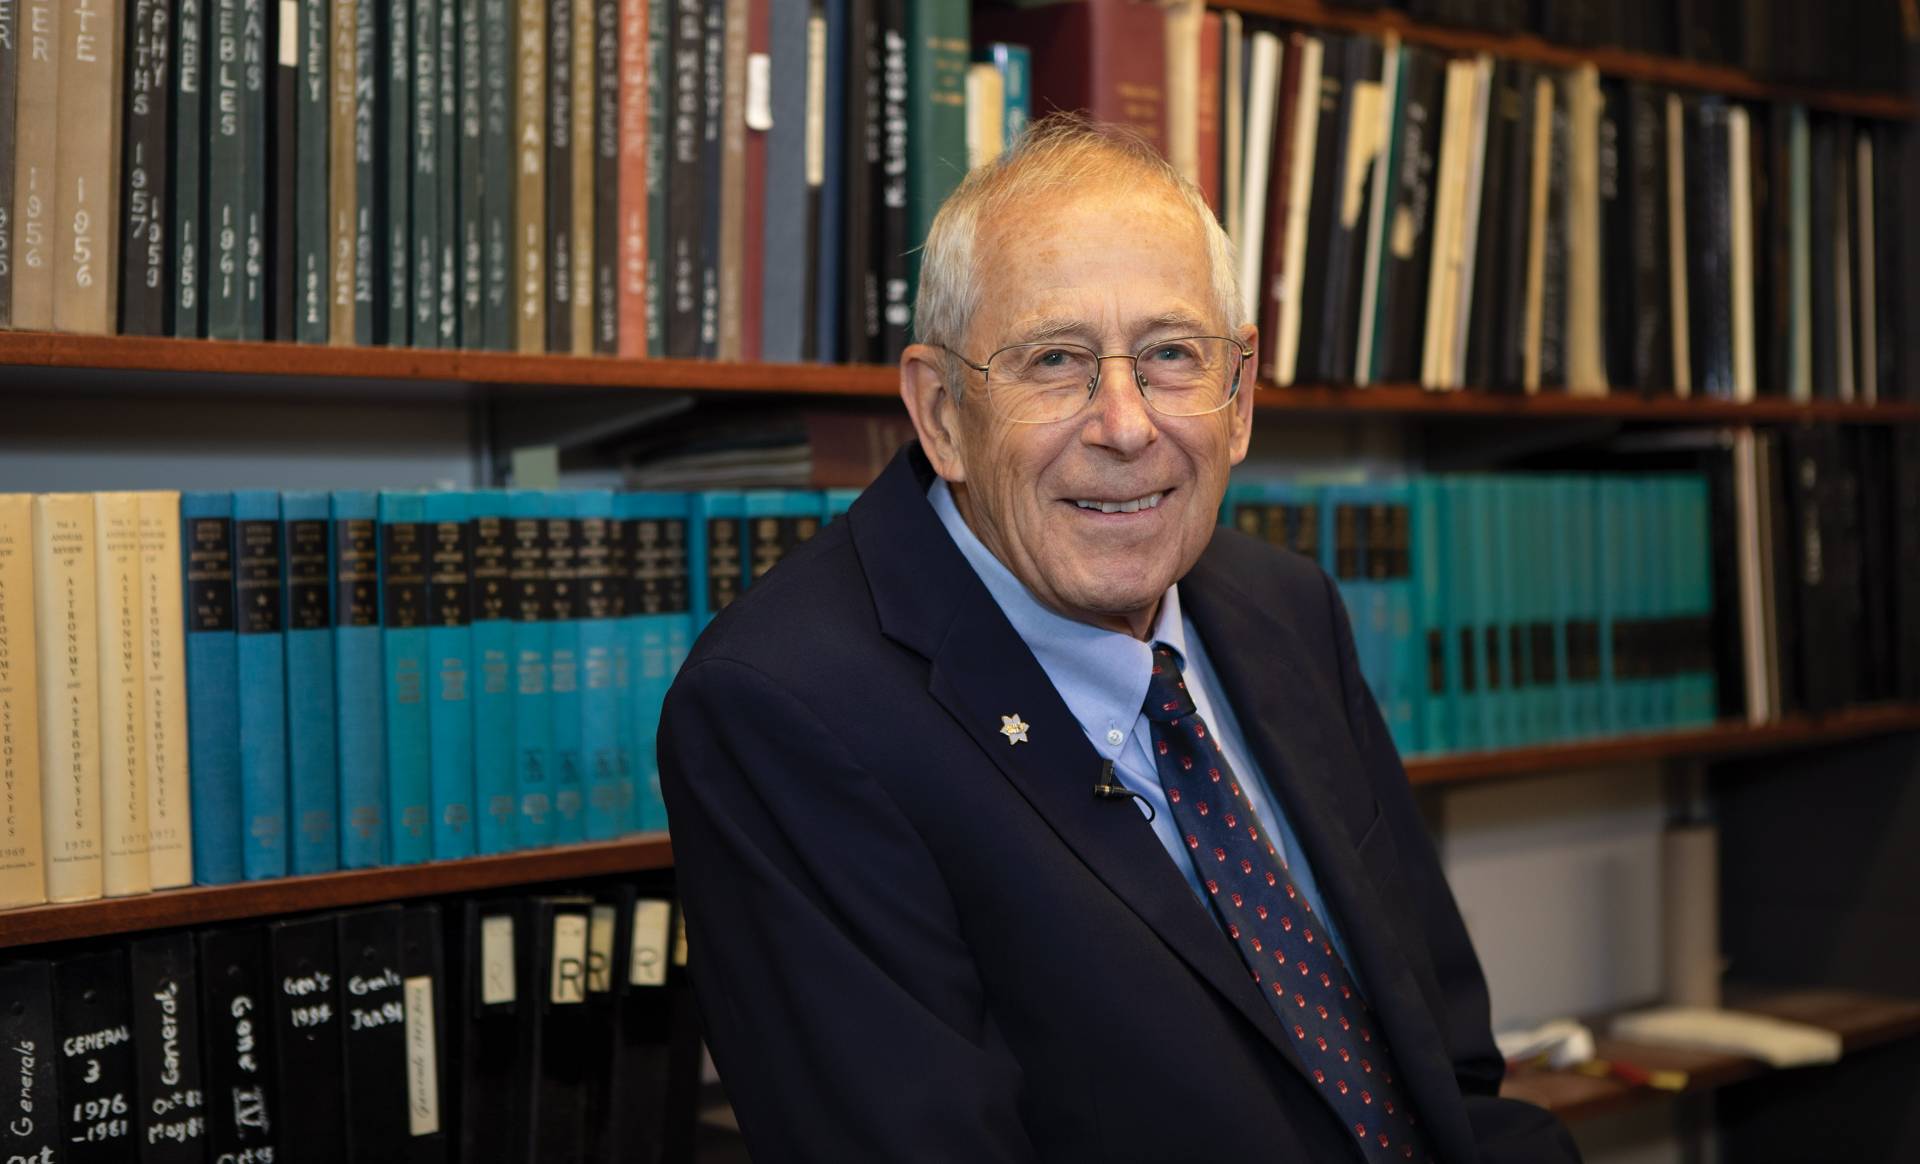
The Nobel Prize for Physics has been awarded this year to Jim Peebles for ” theoretical discoveries in physical cosmology” and to Michel Mayor and Didier Queloz for “the discovery of an exoplanet orbiting a solar-type star”.
It happens regularly that the Nobel Prize is split, but in this case there is hardly a connection between the two topics, and the Nobel committee must have realised that, by adding that the prize this year was won for “contributions to our understanding of the evolution of the universe and Earth’s place in the cosmos”
In this post I will concentrate on Jim Peebles, maybe in a later post I will write more about the discovery of the other two physicists.
The scientific career of Peebles is closely associated with the Cosmic Microwave Background (CMB) radiation, so I will first explain what it is and how it was discovered.
According to the Big Bang theory, the Universe came into being 13.8 billion year ago. Incredibly tiny, hot and dense, it started to expand, while cooling. In the beginning it was a soup of gluons and quarks, but after a few minutes (!) the temperature had dropped so much that “normal” matter, like protons, neutrons and electrons became stable and even some light elements like deuterons and alpha particles could be formed. But it was still a plasma for many thousand years, until after around 380.000 years the universe had cooled so much that electrons and nucleons could form neutral atoms, like helium and hydrogen. From that time onwards until present photons could travel freely, the Universe had become transparent.
In the 1960’s Dicke and Peebles at Princeton studied this Big Bang theory, which was still not universally accepted at that time. If the Universe started with a “primordial fireball” , remaining radiation of this fireball should still be present. But the Universe has expanded about 1000 times since it became transparent, so the wavelength of that radiation has also increased 1000 times! No longer visible (reddish) light, but microwaves with a wavelength in the order of cm/mm’s, corresponding to a temperature of only a few Kelvin.
To detect this kind of radiation you need a microwave radiometer , and two colleagues of Dicke and Peebles, Roll and Wilkinson, also at Princeton, were building one. Then they learnt that two scientists at Bell Laboratories, Penzias and Wilson, only 60 km away from Princeton, were actually working wich such a radiometer and had found results they could not explain. Here is a photo of the Holmdel Horn Antenna, used by Penzias and Wilson.
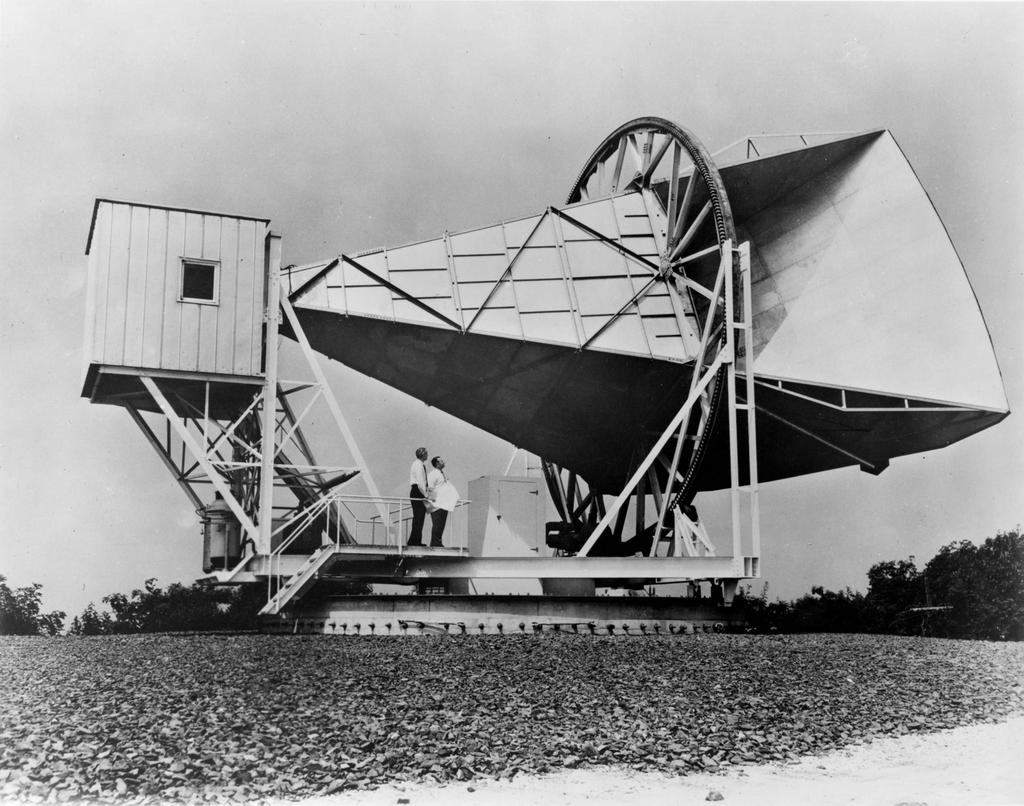
What was it they could not explain? Well, measuring microwave radiation is not easy, because there is much “noise” from many sources, which you have to eliminate or take into account. What they found was that there always remained a background corresponding to a absolute temperature of 3.5 Kelvin. It did not matter which part of the sky they pointed the horn to, and whether it was day or night, there was always this background. They even cleaned the inside of the horn, removing pigeon droppings!
When the two teams came together, the solution was immediately clear. Penzias and Wilson had inadvertently discovered the Cosmic Microwave Background radiation, predicted by Dicke and his team. “Well, boys, we’ve been scooped “, Dicke supposedly said.
The two groups decided to write separate articles for the Astrophysical Journal of 1965, referring to each other. Cosmic Black-Body Radiation by Dicke, Peebles et al. and , very modestly titled, A Measurement of Excess Antenna Temperature at 4080 Mc/s by Penzias and Wilson.
In 1978 Penzias and Wilson received the Nobel Prize for Physics “for their discovery of cosmic microwave background radiation” Of course many in the scientific community found that the Nobel Prize should have been awarded to both teams. But (old fashioned) Nobel Prize rules made that impossible, teams can not get the Nobel Prize, only individuals (maximum three).
Roll and Wilkinson continued with their experiment and published the results the next year in the Physical Review Letters: ” Cosmic Background Radiation at 3.2 cm-Support for Cosmic Black-Body Radiation. Searching information for this post, I found a fascinating article, written a few weeks ago by Peter Roll, now retired of course, about his perspective on the 1965 discovery of the CMB. VERY readable, also for non-physicists.
I have written in some detail about the discovery of the CMB radiation because the importance of this discovery can hardly be overestimated. It changed the Big Bang theory from a controversial hypothesis into the standard model for the evolution of the universe. Here is another very readable article in Physics Today, one year after the discovery: A Bang, not a Whimper?
Of course there were still many questions. If the radiation was really thermal, it should have a well-defined spectrum. And it was of course very convincing that the radiation was the same at each point of the sky, but actually there should be minuscule differences, how else could stars and galaxies have formed, if the early universe was completely homogeneous?
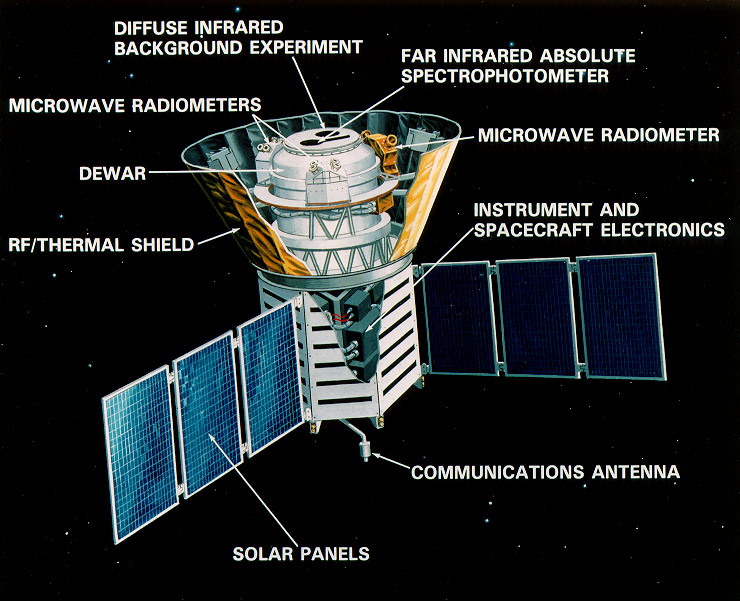
The best way to investigate these questions, was to launch a spacecraft and observe the radiation outside Earth’s atmosphere. And that’s what happened. In 1974 NASA asked for scientific proposals and in 1989 the Cosmic Background Explorer (COBE) was launched. Two main experiments, FIRAS by John Mather, to determine the spectrum of the CMB radiation and DMR by George Smoot to measure the miniscule differences (the “anisotropy”) of the CMB.
Here is the spacecraft. Dimensions (without solar panels) ~ 4,5 x 2,5 m. The experiments are indicated, the Dewar contained liquid helium to cool especially FIRAS to near absolute zero temperature.
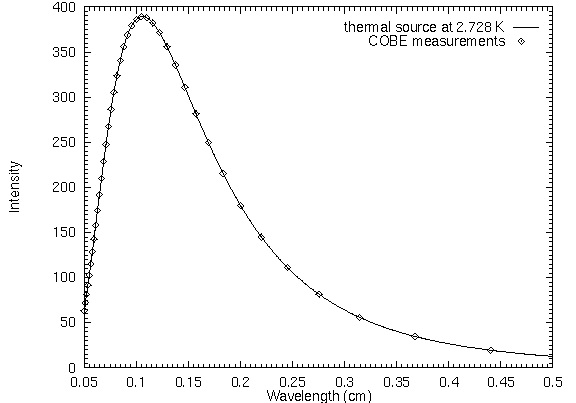
Here are the results. The CMB spectrum fits so perfectly the shape of a thermal source (“blackbody”) that it received a standing ovation when it was presented to the American Astronomical Society in January 1990.
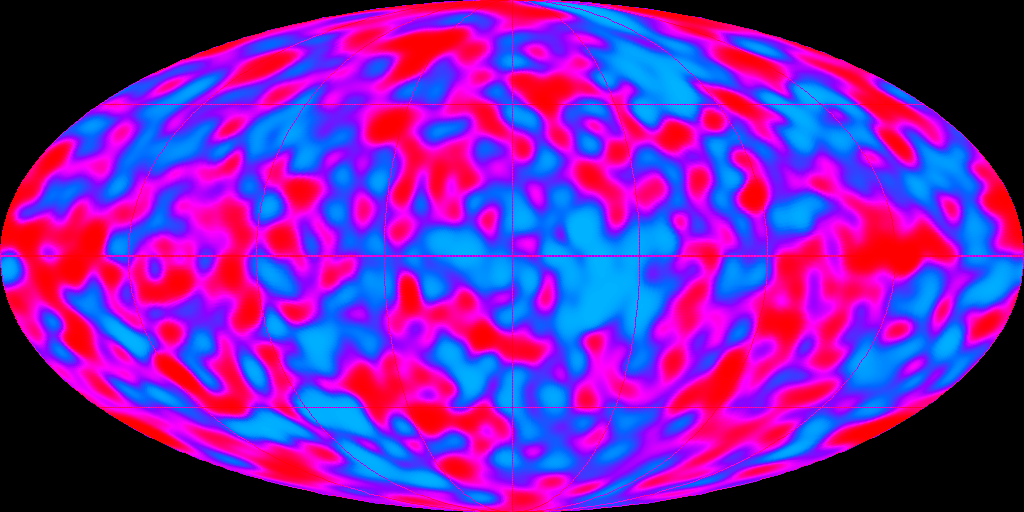
The temperature of the CMB is 2.728 K, but Smoot found indeed tiny differences, depending on the location in the sky. Here is a map of the sky, with the temperature differences indicated in red (slightly warmer) and blue (slightly colder). When these results were published in 1992, they were frontpage news in the New York Times and Stephen Hawking in an interview called it “the greatest discovery of the century, if not of all times”.
In 2006 Mather and Smoot received the Nobel Prize for Physics “for their discovery of the blackbody form and anisotropy of the cosmic microwave background radiation”
Through the CMB we are looking back to the very young universe, 380.000 year old, before stars and galaxies were formed. Exploring these temperature differences, may help us to understand the evolution of the universe. But then a more detailed map of this anisotropy is needed!
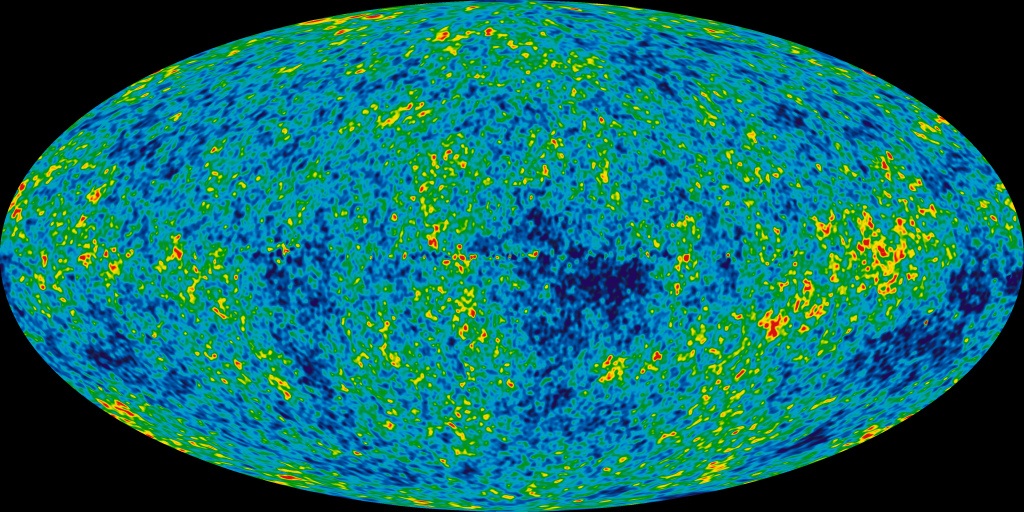
In 2001 the Wilkinson Microwave Anisotropy Probe (WMAP) was launched. Until 2009 data have been collected, resulting in maps like this one, much more detailed.
And in 2009 the Planck observatory was launched. The instruments on board were cooled until 0.1 Kelvin, making it the coldest object in the universe..:-) Here is the Planck map, even more detailed.

You may wonder about the shape of these maps. It is called the Mollweide projection and it minimises the distortion you always get when you project a sphere on a plane. For comparison, here is the Mollweide projection of Earth.

There are two other discoveries in cosmology during the past 50 years that I have to mention, before I can finally come back to Jim Peebles and his Nobel Prize 🙂
The first one was the discovery of Dark Matter. In the 70s the American astronomer Vera Rubin studied the rotation of galaxies like the Andromeda galaxy and found that the outer regions of the galaxies were rotating much faster than expected, based on the visible matter of the galaxy and Kepler’s laws. An explanation could be that galaxies are surrounded by a halo of invisible (“dark”) matter. The existence of this Dark Matter has been widely accepted by the scientific community, but we still do not know yet what it is. According to many physicists, she deserved a Nobel Prize for her research, but she never got it. Because she was a woman? She passed away in 2016, Nobel Prizes can not be awarded posthumously. Here is a necrology: Vera Rubin, invisible to the Nobel Committee.
The second discovery was made in the 90s by two teams of astronomers who were studying the expansion of the universe. The Big Bang theory predicted that the expansion would slow down, because of the force of gravity. The crucial question was: will this force be big enough to stop the expansion, followed by a contraction, ending in a Big Crunch, or will the expansion go on forever. The result of their research was shocking: the expansion is not slowing down, but accelerating! There must be a repulsive force, which was called Dark Energy. Also here we do not know what it is. In 2011 the leaders of the two teams were awarded the Physics Nobel Prize “for the discovery of the accelerating expansion of the Universe through observations of distant supernovae”. I wrote a blog about it: Physics Nobel Prize (2011).
So, what did Jim Peebles discover? Nothing actually, and that may have been a reason that he received the Nobel Prize so late in life (he is now 84 year old) as the Nobel Committee has a preference for (experimental) discoveries.
But Jim Peebles rightly deserves the Nobel Prize because he has been instrumental in developing the theoretical cosmological framework for what is called physical cosmology. In 1982 he published a groundbreaking article about a cosmological model with dark matter in it and in 1984 an article in which he added the cosmological constant Λ (now called dark energy) to his model. This model , the Λ CDM model, is at present the standard model of cosmology. For this work Peebles could (should) have been awarded the Nobel Prize many decades ago! Well, better late than never 🙂
With this Λ CDM model, using the properties of the CMB radiation and other experimental results, it is possible to determine how much normal matter, dark matter and dark energy there is in the Universe. The best fit to the (Planck) CMB data is obtained with the following values:
- Atomic matter 4.9 %
- Dark Matter 26.8 %
- Dark Energy 68.3 %
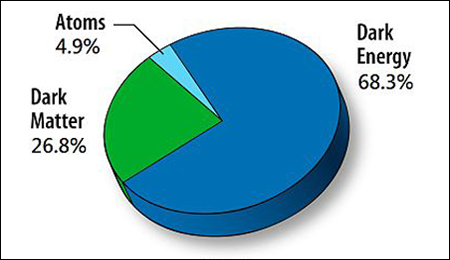
Probably most of you will have seen this result. Everything we observe around us, our earth, the sun, the planets, the galaxies, it is only ~ 5% of our universe. About the other 95% we know basically nothing. Astonishing and mind-boggling.
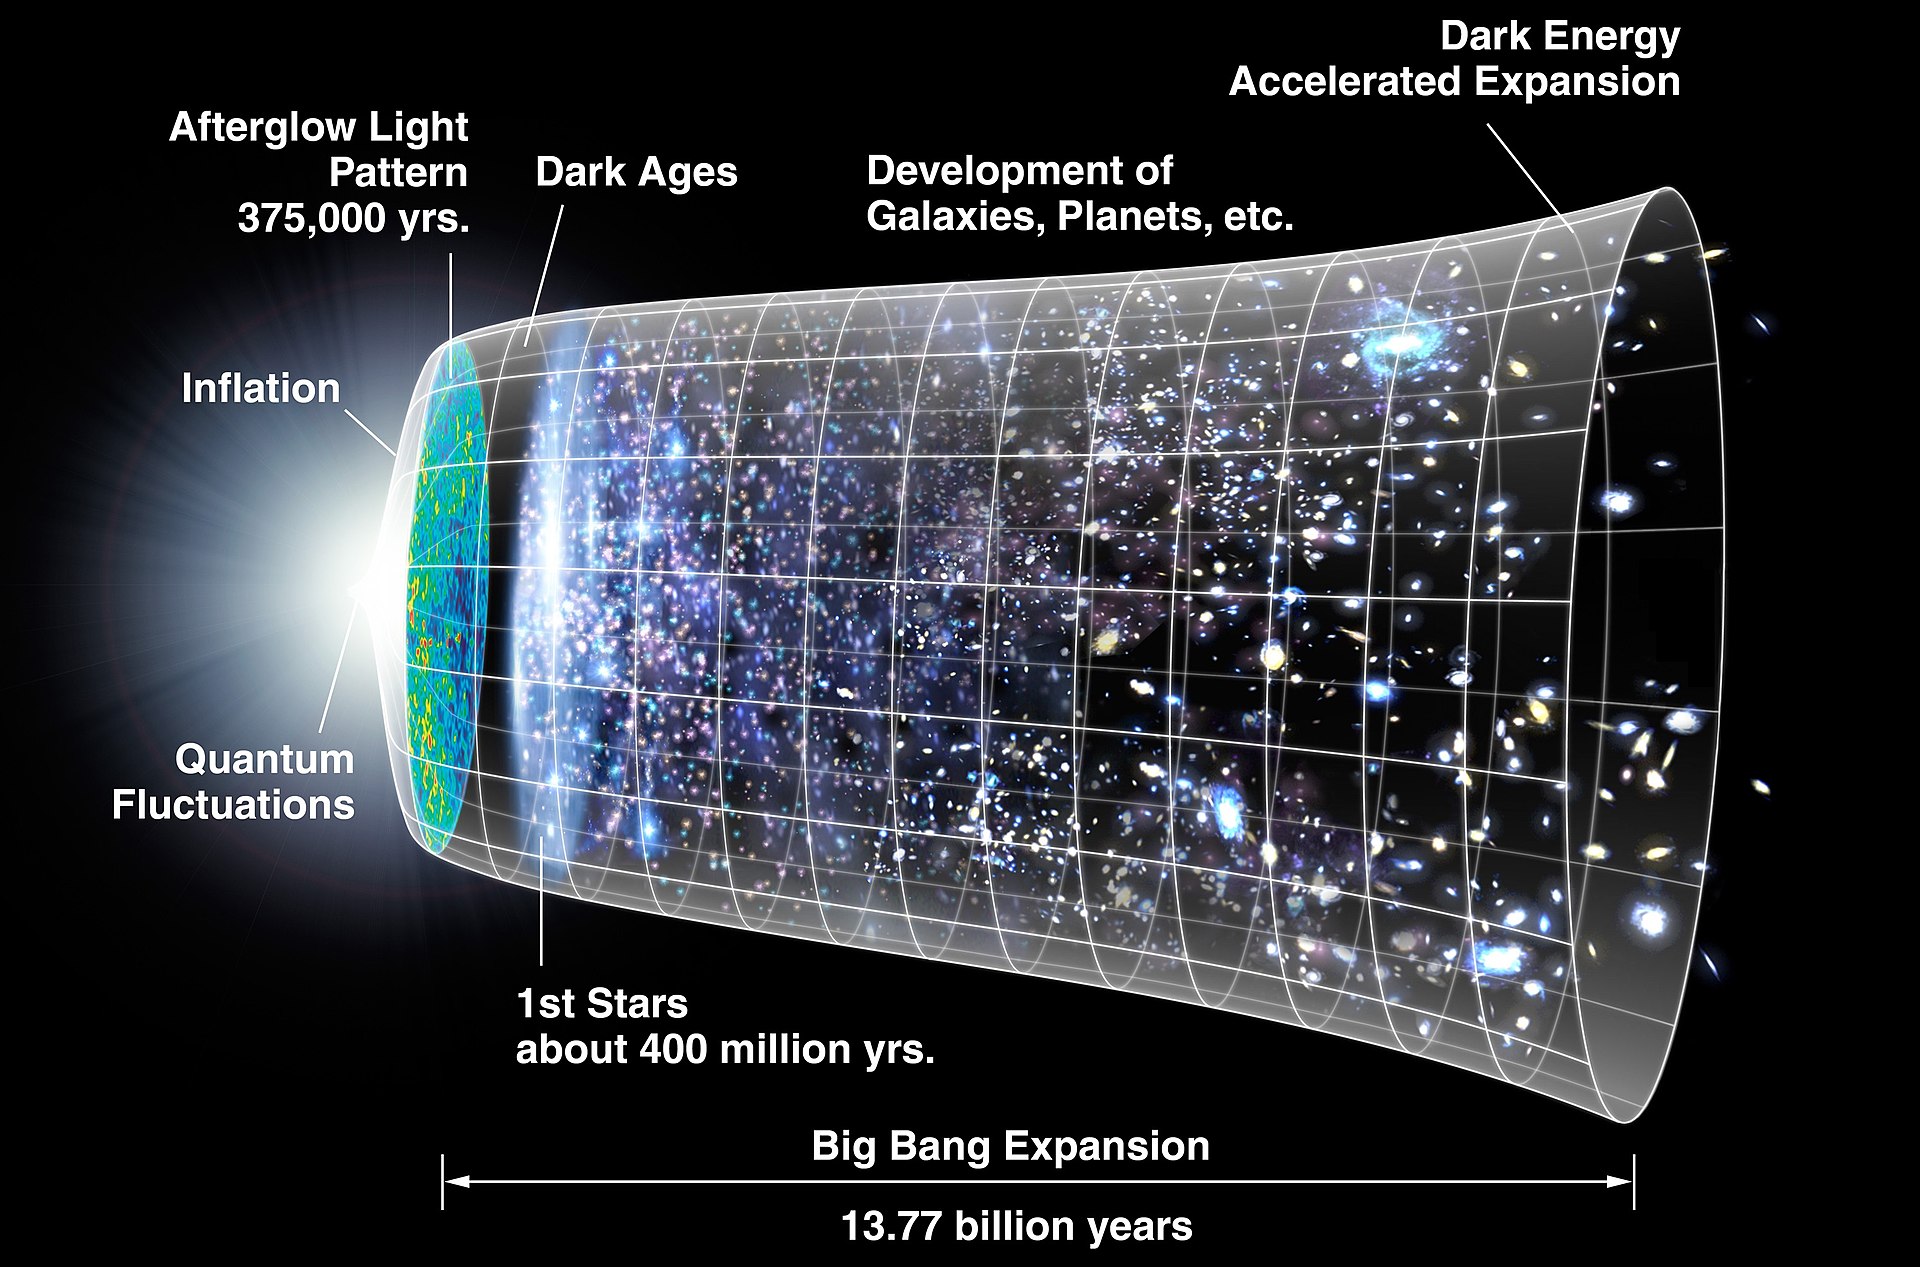
Let me finish this post with two images. Below is an overview of the Big Bang expansion. The CMB is seen to the left, called the Afterglow Light Pattern. To the left you see “Inflation” and “Quantum Fluctuations”. The present theory is that in the first ~ 10−32 (!) second, the universe expanded exponentially. I don’t feel qualified to write a post about it, see the Inflation article in Wikipedia.
When the universe became transparent after 380.000 year, there were no stars and galaxies yet, the universe was dark, except for the afterglow! It took hundred millions of years, before the first stars were formed. More info in Wikipedia’s Chronology of the universe.
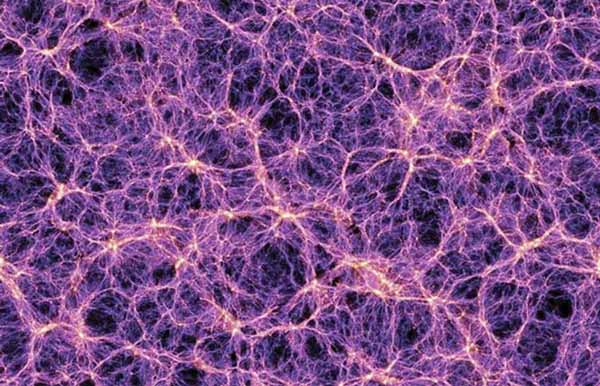
In 1980 Peebles published a book Large-Scale Structure of the Universe and that has always been his primary interest. There are about 200 billion galaxies in the observable universe, are they just randomly distributed? The answer is no, they are part of what nowadays is called the Cosmic Web. They are concentrated along filaments, with huge voids in between. In this artist impression, each light dot is a galaxy. Another mind-boggling image. 🙂 .
In 2013 I have written a post : Largest Structure in the Universe discovered, very readable if I may say so 🙂
APPENDIX
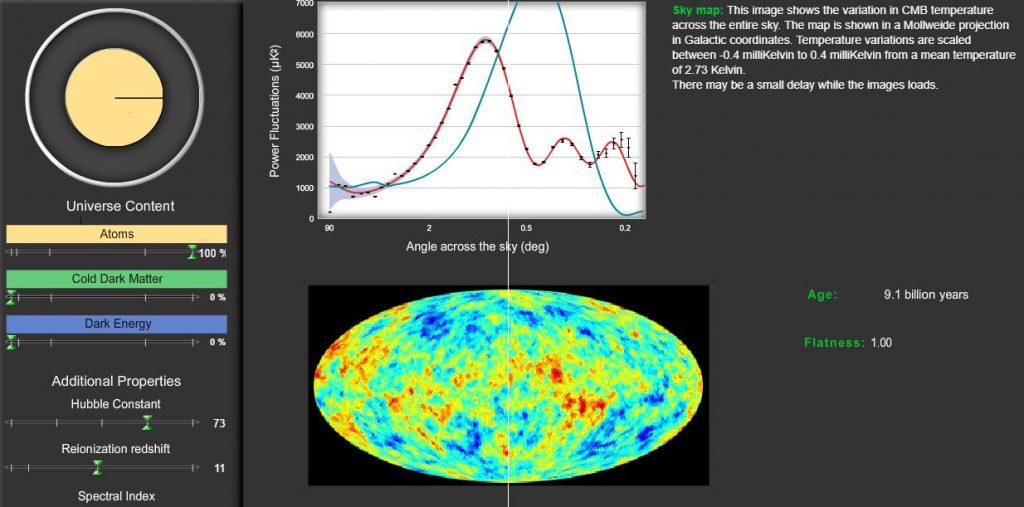
How is it possible to extract the values for dark matter, dark energy etc from a map of the sky with minuscule temperature differences?
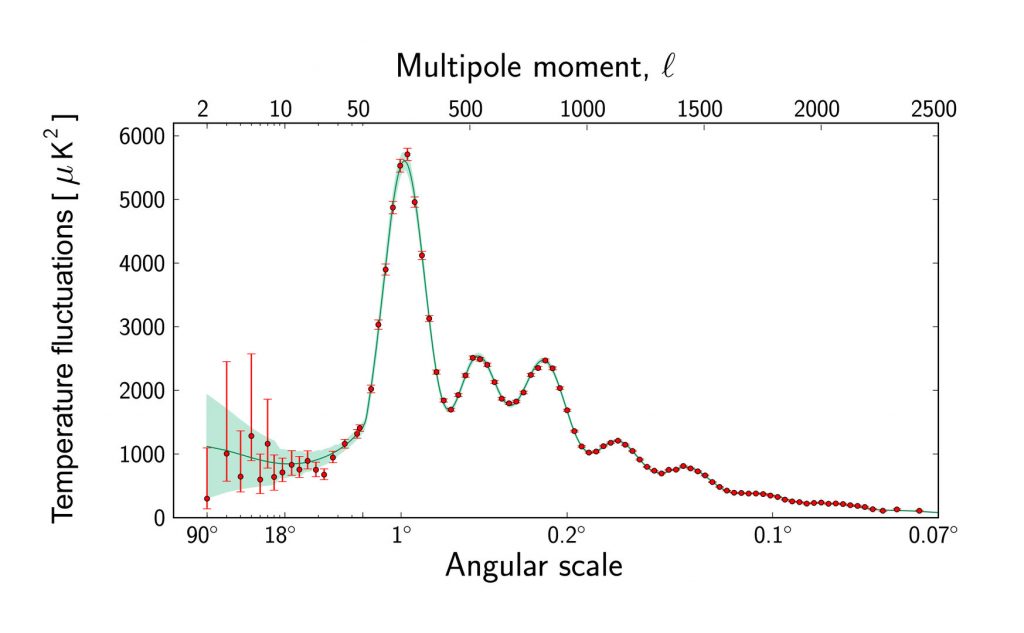
The first step is to “translate” the temperature differences into what is called a power spectrum. The CMB map has cold and warm patches in various sizes. A power spectrum gives the intensity of these patches as function from their (angular) size.
Here is the power spectrum of the PLanck CMB map. The largest temperature fluctuations are found in patches of around 1 degree. Notice that the angular scale runs from left (large patches) to right (small patches). The red dots come from the CMB map. The green line is the best fit from the Λ CDM model, using the parameters given above.
Here is an instructive video, how the different parts of the power spectrum correspond from left to right to increasingly detailed structures.
The calculations are complex and need powerful computers.
In this simulation: Build a Universe you can play around with the various parameters. To run it on your computer, you need to have Flash installed. Not everybody will have Flash, so I have taken two screenshots. The first one, shows the “fit” for a universe with only normal matter. The second one uses parameters like given above.