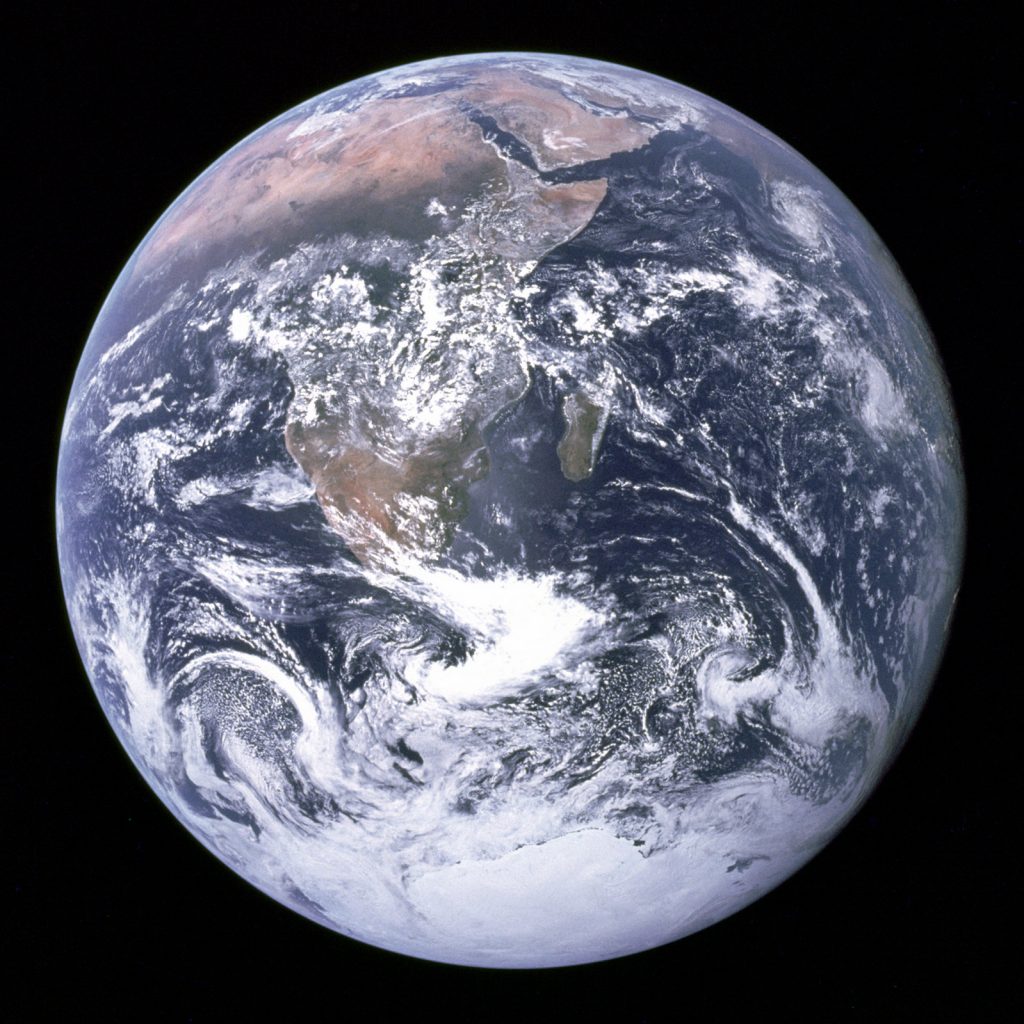
In 2019 I wrote a blog post A Pale Blue Dot with these two pictures in it. Left the iconic picture of Earth, taken in 1972 by the crew of the Apollo 17 spacecraft, on their way to the Moon. Right a picture taken in 1990 by the Voyager 1, leaving the solar system and looking back to Earth At 6 billion km only a pale blue dot.
Earth is our beautiful world, one of the eight planets in the Solar System and the only one where life has developed, as far as we know.
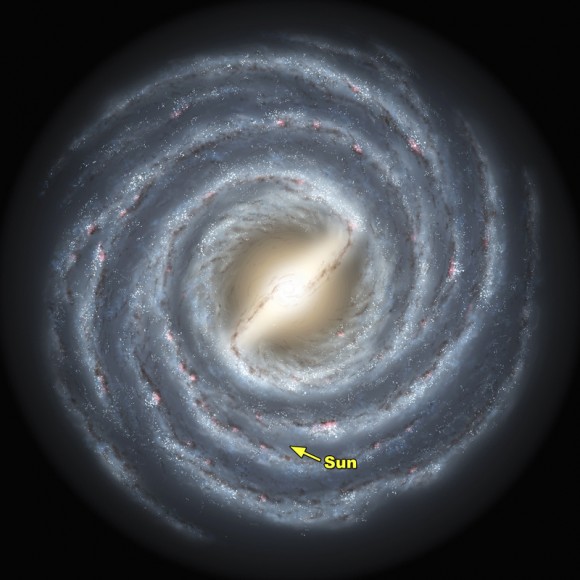
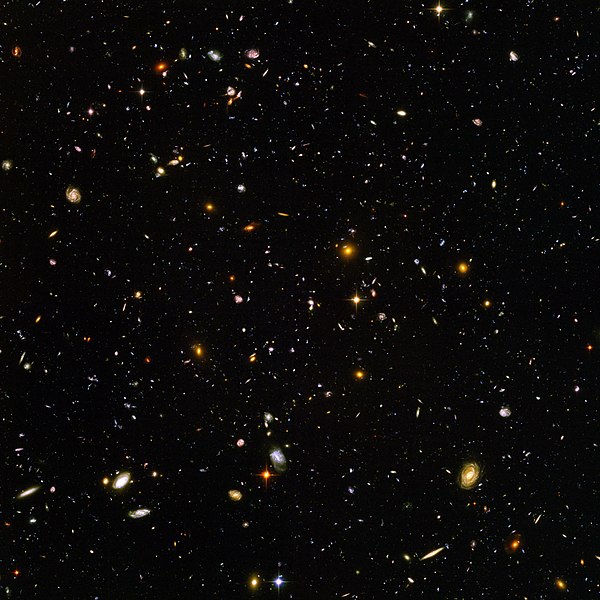
Are there other worlds in the Universe? Our Sun is one of about 100 billion stars in the Milky Way and the MIlky Way is one of an estimated 200 billion galaxies in the (observable) universe.
The left picture shows the spiral structure of the Milky Way, with the location of our Sun marked. The right picture is the famous Ultra-Deep Field image taken in 2003 by the Hubble telescope. The image shows an estimated 10.000 galaxies in a part of the sky with a diameter 1/10th of the moon.
In 1992 the first extrasolar planet (exoplanet) was detected, at the time of writing this blog more than 5000 have been found and it is now assumed that most stars will have at least one planet orbiting it. That means that in the Milky Way alone there are already billions of planets.
Wouldn’t it be strange if Earth is the only planet where (intelligent) life has developed? There could be numerous planets in the Milky Way and Universe where life has developed. Michio Kaku an American ‘science communicator’, who always enjoys being in the limelight, goes even further: “The Laws of Probability Tell Us That the Universe Should Be Teeming With Intelligent Life Forms”
The Laws of Probability ? As usual I am a sceptic. In 2010 I wrote two posts about “Are we alone in the Universe“. My personal opinion at that time was: “Yes, we might well be alone“. Now, thirteen years later, my opinion is still the same, maybe even stronger.
After this lengthy introduction, time to go back to the topic of this post, the Drake Equation.
Speculation about extraterrestrial life dates back to antiquity. Around 1900 it was thought by many that the planet Mars had irrigation canals, built by intelligent beings. Development of more powerful telescopes showed that those canals were an illusion. But maybe there were intelligent beings outside our solar system? This led in the 1960’s to the SETI program. the Seach for Extra-Terrestrial Intelligence. Involved in this program was Frank Drake, a young American astronomer. To have discussion points for the first scientific SETI meeting, he came up with what is now called the Drake equation.
Actually it is NOT an equation, it is an estimate for the number of intelligent civilisations in our Milky Way. The idea is simple, you start with how many stars are born yearly in the Milky Way. How many of these stars will have planets, how many of these planets will be suitable for life, how many of these suitable planets will actually develop life. How many planets with life will develop civilistations (intelligent life), and how many of these civilisations will be able/willing to communicate with us. And finally, how many years will such a civilisation survive.
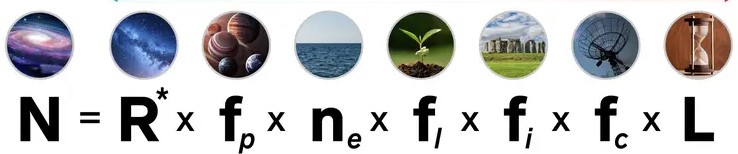
Here the Drake equation is visualised: The estimated number of intelligent civilisations in the Milky way who can communicate with us is given by N as the product of a number of factors.
R* = how many stars are born every year in our galaxy. (R∗ = 1 yr−1)
fp = the fraction of these stars that have planets. (fp = 0.2 to 0.5)
ne = the average number of planets in the habitable zone of such a star (ne = 1 to 5)
fl = the fraction of habitable planets that actually develop life. (fl = 1)
fi = the fraction of those planets, where evolution leads to civilisations with intelligent life (fi = 1)
fc = the fraction of these civilisations that develop a technology capable of releasing detectable signs of their existence into space. (fc = 0.1 to 0.2)
L = the length of time that such a civilisation will exist.(L = 1000 -100,000,000 years)
In the 1961 discussion the various factors were discussed. I have given these estimates above. Using the lower limits, it gives a minimum of N ≈ 20 technological;y advanced civilisations, who could send signals to us. If those civilisations have not self-destructed, L could be many millions of years resulting in maximum of N ≈ 50.000.000 !
With this evaluation you will understand that it made sense to start the SETI program. After a few years a distributed computing project SETI@Home was started, where volunteers could use the idle time of their PC’s to analyse data from radio telescopes, searching for signals. of intelligent life . Many years I have taken part in this program. My PC during idle time was doing this.
After about 20 years the program was stopped, without any results. But in 2016 a follow-up project started Breakthrough Listen. Basically the same as SETI, but much more powerful, it will generate as much data in one day as previous SETI projects generated in one year. Until now no positive results.
I ended my 2019 post with :”As soon as evidence of life will be found, on Mars or deep under the frozen oceans of Jupiter’s moon Europa, I will celebrate and be convinced that life indeed is teeming in the Universe. Until then, I believe in the Rare Earth Hypothesis , that we might well be alone.“
What is this Rare Earth hypothesis? In 2000 Ward and Brownlee published a book Rare Earth: Why Complex Life Is Uncommon in the Universe in which they argue that primitive (microbial) life may be common in the Universe, but that complex (intelligent) life is probably very rare.
I agree with them that complex life will be rare in the Universe, but I no longer think that primitive life will be common.
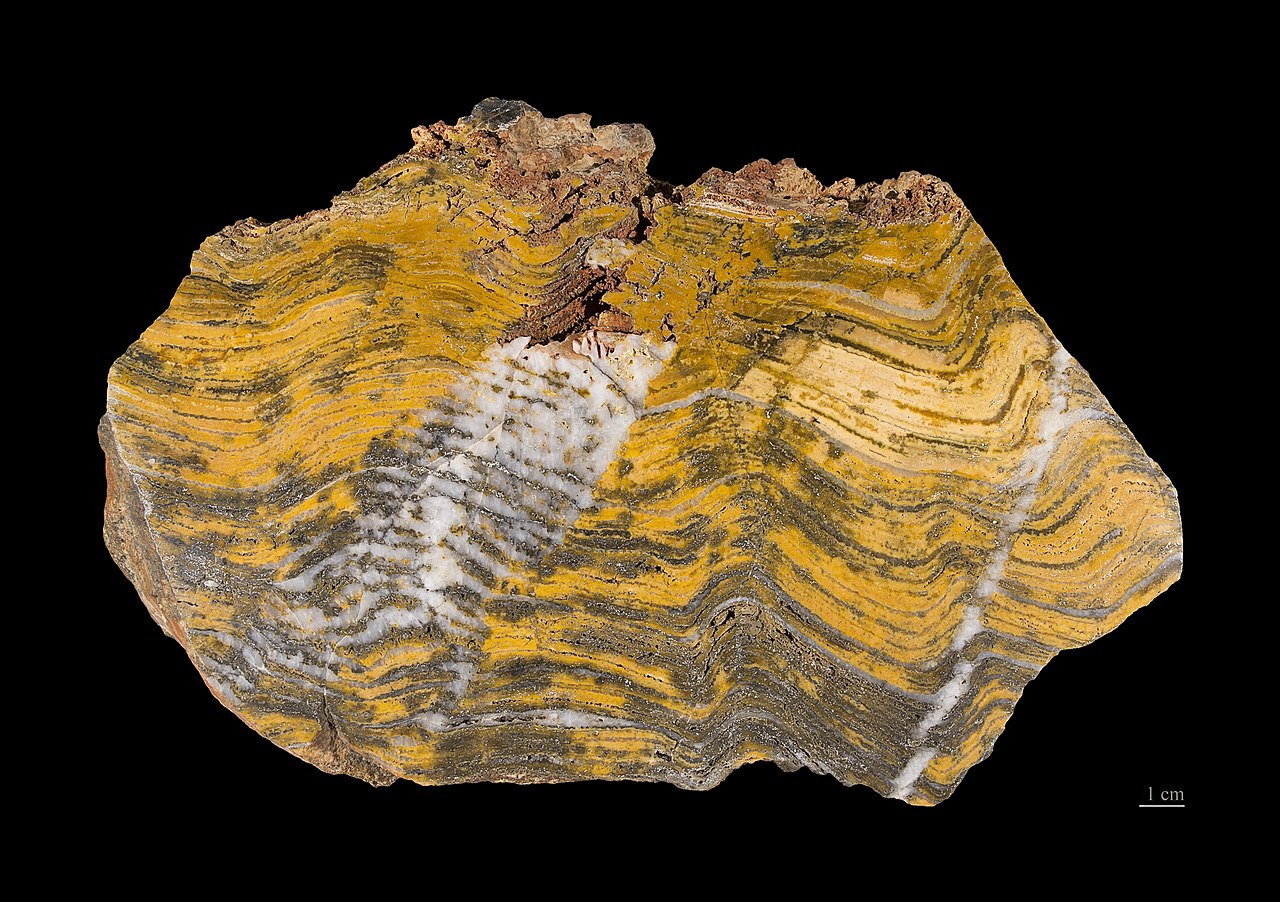
A few months ago I published a post Perseverance perseveres about the Mars rover who is looking for traces of past life on the planet Mars. The scientists were expecting/hoping to find stromatolites, fossils of microbial life formed in the time that Mars had water. Something similar to this, found in Australia, 3.4 billion year old.
Stromatolithe – MNHT
Until now no sign of fossil microbial life has been found. So it could be that the chance that primitive life develops on a planet in the habitable zone is also small!
As long as no sign of (fossil) microbial life is found in our solar system or elsewhere, I think that even primitive life may be rare in the universe. I used to say, We may be alone in the Universe. I now go one step further:
On 25 December 2021, the James Webb Space Telescope (JWST) was successfully launched. It has now reached its destination at the L2 Lagrange point of the Sun-Earth system. For many years I have considered writing a blog about the five L:agrange points, but I was not sure if I could do that in a relatively simple way.
I am still not sure, but in this blog I will give it a try.
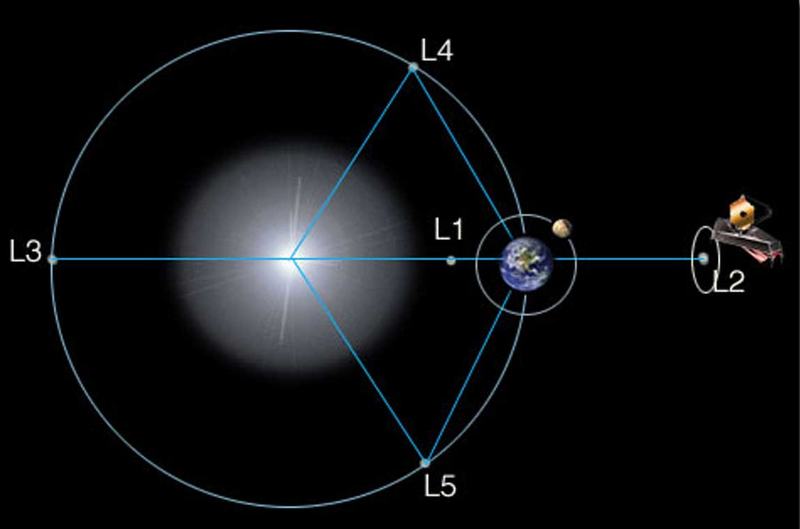
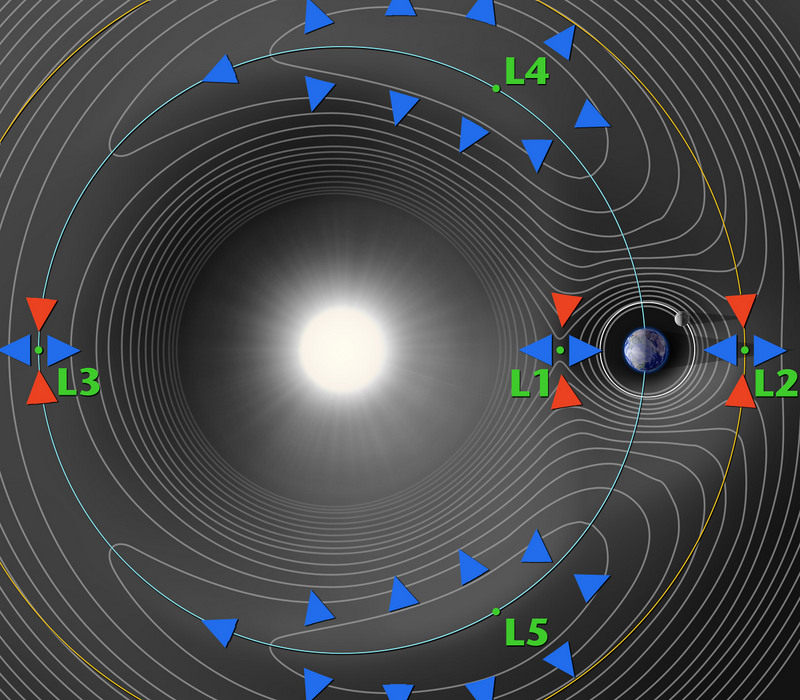
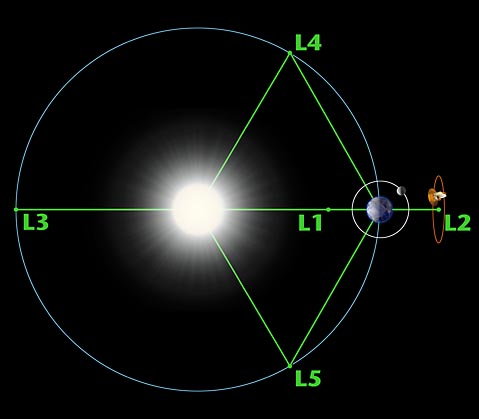
Here is a diagram of the Sun-Earth system (not to scale). The five Lagrange points are marked.
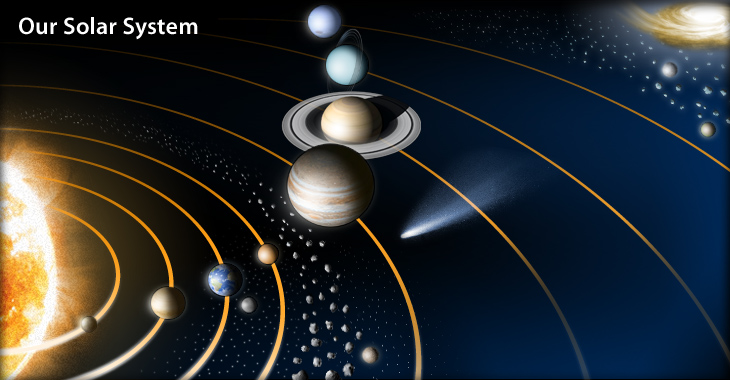
Earth and all other planets orbit the Sun because of the gravitational attraction between a planet and the Sun. Earth orbits the Sun in ~365 days at a distance of 150 million km. The other planets do the same, but at different distances and with different periods. Here is the solar system (not to scale).
It was Kepler who studied the planetary motion. He found a relation between the period and the distance, which is now called Kepler’s Third Law: The square of a planetary period is proportional to the third power of its distance. Let’s take Mars as an example. The distance to the Sun is ~228 million km and a Mars year is ~687 days. The distance is a factor 228/150 = 1.52 larger. The third power of 1.52 is 1.52×1.52×1.52 = 3.512. Kepler’s 3rd law predicts that a Mars year will be √ 3,512 = 1.88 times longer than an Earth year. = 1,88 x 365 = 686 days.
Now let us consider a spacecraft in the Sun-Earth system. It’s mass is so small compared to the mass of Sun and Earth, that it will not influence their motion. But it will feel the gravitational attraction from the Sun and also from the Earth. Is it possible that the combined attraction of Sun and Earth will result in a period of 1 year?
The answer is yes, there are exactly 5 points where this is the case, the 5 Lagrange points!
Here is the explanation for L2. This point lies farther away from the Sun than Earth, so the attraction from the Sun is weaker and would result in a longer period. But Earth also attracts the spacecraft in the same direction as the Sun and in L2 they give together enough attraction to let this point orbit in 1 year. Calculation gives that L2 is located 1.5 million km from Earth, 151.5 million km from the Sun
For L1 the explanation is similar. Here the attraction of the Sun is stronger resulting in a shorter period. But now Earth “pulls back” and together they give the right amount of attraction. The location of L1 is also 1.5 million km from Earth, 148.5 million km from the Sun (the figure above is not to scale).
L3 lies at the opposite side of the Sun, Here the attraction from Earth is minimal, it contributes only little to the attraction of the Sun, so L3 lies only slightly further away than 150 million km from the Sun.
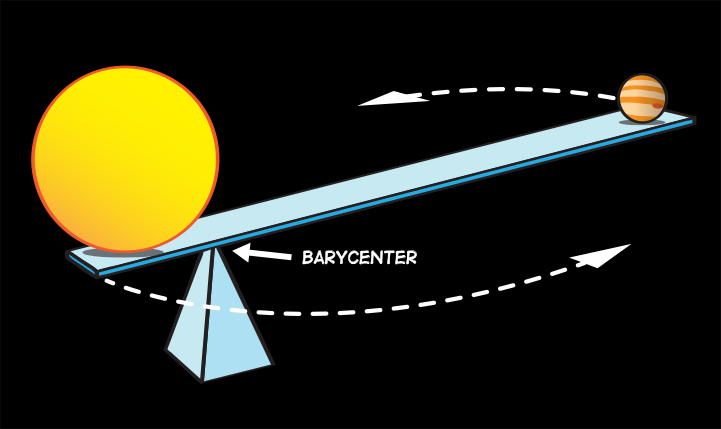
Before we describe the points L4 and L5, we will first look in a bit more detail at the solar system. When we say that the planets orbit the Sun, it suggests that the Sun doesn’t move itself, while the planets orbit around it. And that is not true. The Sun and a planet both orbit around their common center of mass, often called their barycenter. In this image the barycenter is shown for the Sun and Jupiter. Because the Sun is much more massive than Jupiter, their barycenter lies close to the Sun.
Here are a few animations for different situations, where the barycenter is marked with a red cross. The animations are not to scale. The first image shows the situation of for example two stars of equal mass. The next one shows minor planet Pluto and its large moon Charon. The last image shows Earth and Sun. The mass of Earth is so small that the barycenter lies within the Sun.
Of course the resulting force in the Lagrange points has to be directed to the barycenter and for L1, L2 and L3 this is automatically the case, because these points lie all three on the line connecting Sun and Earth. These points were already found by the famous mathematician Euler in 1720.
In 1772 Lagrange discovered two more “stable” points, where the attraction of Sun and Earth are not in the same direction, but together point to the barycenter. of the Sun-Earth system. .
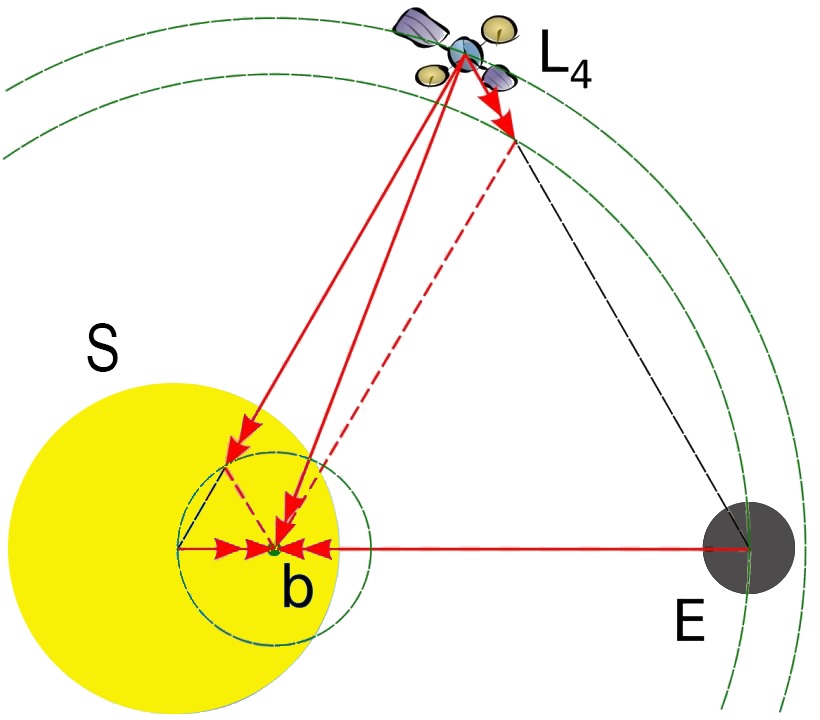
The mathematics is complicated, I will use some hand waving to make the existence of L4 (and L5) plausible. In the diagram below, the masses of Sun and Earth are S and E , the barycenter is indicated as b, it lies within the Sun because the Sun is much more massive than the Earth. The location of b depends on the ratio of the two masses S and E;.
L4 is the top of a triangle with all sides equal to the distance between Earth and Sun. Because L4 has an equal distance to Earth and Sun, the gravitational forces on L4 are in the same ratio of S and E. Therefore the resulting force is directed to b ! Note that L4 lies outside Earth’s orbit. Similar to L1, the two combined forces give L4 a period of 1 year, same as Earth.
Actually the barycenter of the Sun-Earth system lies extremely close to the Sun’s center of mass, The radius of the Sun is 670.000km and b lies about 450 km from its center! In this diagram this distance has been strongly exaggerated to show the process. In the usual diagrams of the Lagrange points, L4 and L5 are located so close to the Earth orbit, that it is not possible to see their separation.
Until now we have described the 5 Lagrange points as points that orbit the Sun in one year, same as the Earth. Another description is often used, a rotating coordinate system. In such a coordinate system, centered in the barycenter and rotating once a year, Sun, Earth and the 5 Lagrange points are stationary. But it comes at a cost. Because such a coordinate system is not an inertial system, fictitious forces have to be introduced, for example the centrifugal force,
In the diagram below the Lagrange points are indicated, in such a rotating frame. The contour lines give the gravitational field energy. Compare it with the contour lines on a topo map. The blue and red arrows indicate the direction of the force (the direction of the slope in a topo map). In topo map terminology L4 and L5 are located on the top a hill, while the other three are located in so-called saddle points. On first sight it would seem that all Lagrange points are unstable, For the L1-L3 points a small displacement in the x-direction, and for L4 and L5 a small displacement in any direction would be enough to disturb the balance (like a pencil on its tip).
Careful and complicated mathematical analysis (see for example here) leads to a surprising result: the regions around L4 and L5 are actually stable, objects in a large region around these Lagrange points will move in orbits and stay in that region. The regions around the other three Lagrange points are unstable, objects can orbit for a while, but will eventually escape. That is illustrated in the two diagrams below. The left diagram. shows the Sun-Earth system in an inertial frame, the right one in a rotating frame The 5 Lagrange points are marked in red.
Notice the moving tiny points, They are test masses. released near the various Lagrange punts. Look carefully and you will see that the test masses released near L1 and L2 quickly move away. For L3 it takes a bit longer. All these three Lagrange points are unstable. But around L4 and L5 the test masses do not “escape”, these points are stable.
In the introduction of this blog I wrote that the JWST had reached its destination at the L2 Lagrange point of the Sun-Earth system. Actually the space telescope is not positioned in :the Lagrange point itself but orbiting L2. And what an orbit it is! Elliptical, the distance to L2 varies between 250.000 km and 832.000 km. One period takes about 6 months. The orbit is not stable, about every 21 days the thrusters of the JWST must perform minor course corrections.
A more detailed explanation of the WEBB launch and orbit can be found in this brilliant YouTube video: How James Webb Orbits “Nothing”
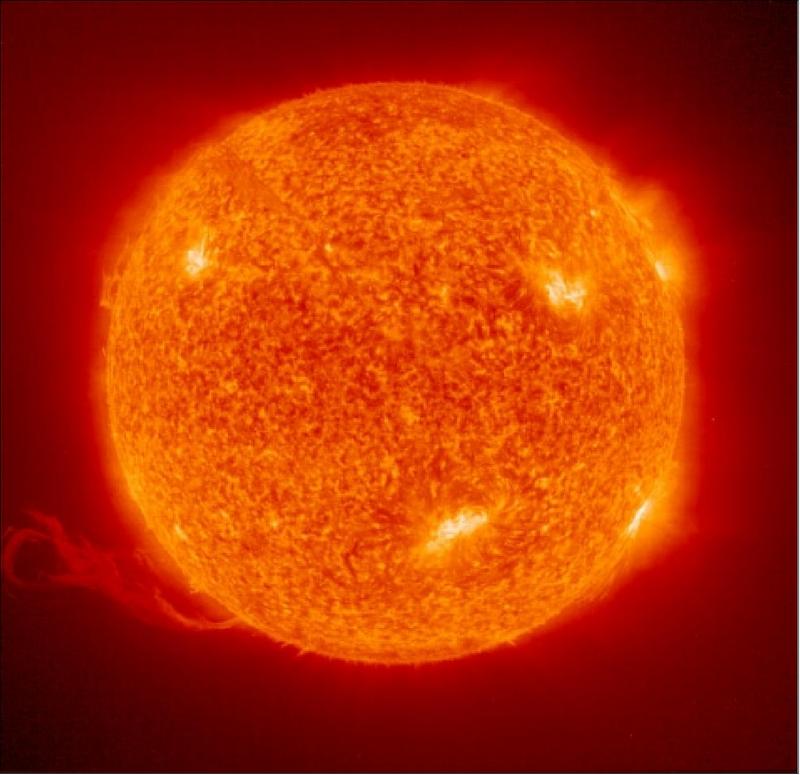
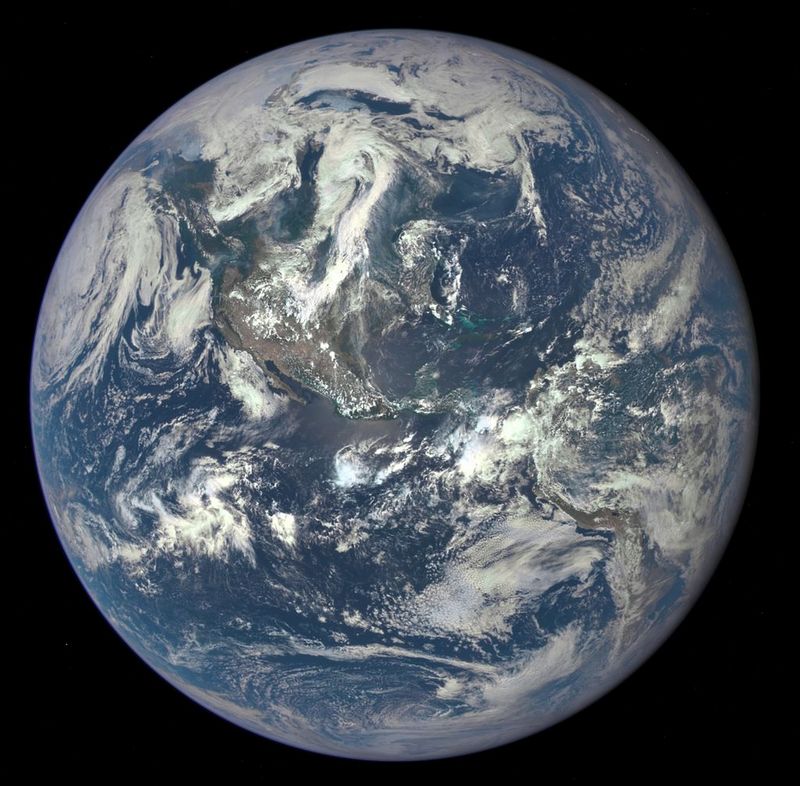
There also satellites orbiting L1. At the moment for example the SOHO satellite to study the Sun and the DSOVR to study the Earth. Here are two pictures taken by these two spacecraft.
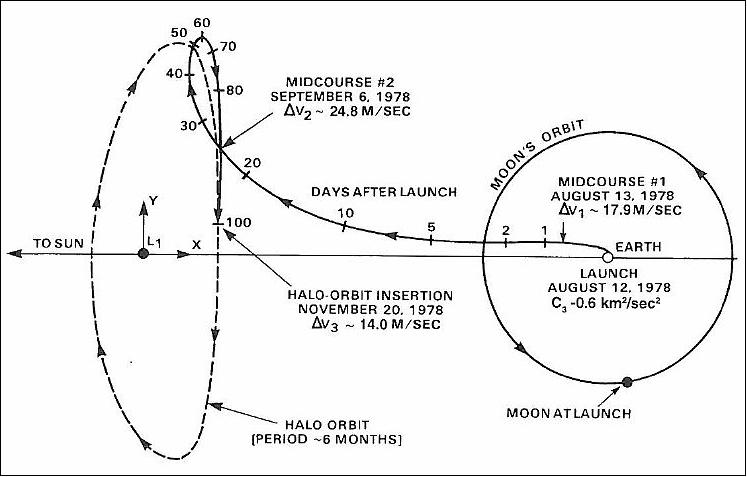
In 1978 the International Sun-Earth Explorer-3 (ISEE-3). was the first spacecraft that went into an orbit around a Lagrange point. It studied the Sun and Earth for 4 years and also here the unstable orbit had to be corrected regularly. Here is a diagram of the launch process.
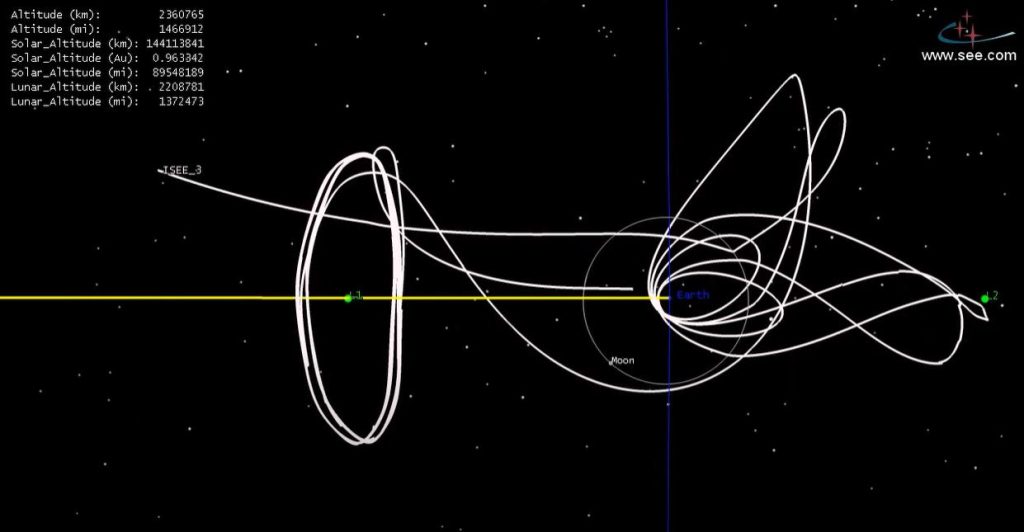
After its mission was completed, the spacecraft got a new target, to study comets! It was renamed International Cometary Explorer, left its orbit and via amazingly complicated manoeuvres went on its way to a comet., Click on the screenshot to see an animation of the mission. Very informative and fascinating..
What about L3? This Lagrange point is permanently behind the Sun, as seen from the Earth. No scientific use, but it has played a role in science fiction. . Here is an example, a science fiction movie Journey to the Far Side of the Sun, released in 1969 (the same year that humans landed on the Moon). Click on the screenshot to watch the movie.
Synopsis of the movie: In 2069 a planet is discovered in L3 and the director of Eurosec (named Jason Webb !) organises a mission to what turns out to be a mirror-earth. Very interesting to watch.
We now know that L3 is unstable, with a “decay time” of about 150 year. It would be a suitable location for alien enemies to hide, while preparing for an attack 😉
L4 and L5 are stable (under certain conditions) but have no use for science. Possibly in the far future, these regions could be used to build human colonies.
Until here we have concentrated on the Lagrange points of the Sun-Earth system, but the Earth-Moon system has also its Lagrange points and so do for example the Sun and Jupiter.
Jupiter has collected thousands of asteroids around its L4 and L5 points. They are called trojans because they are named after heros of the Trojan war. Here is an animation. The asteroids in front of Jupiter are called the Greeks and the ones trailing Jupiter are called the Trojans.
The name trojan is now generally used for objects in the L4 and L5 points of other planets. In the L4 and L5 points of the Earth until now “only” two Earth trojans. have been observed.
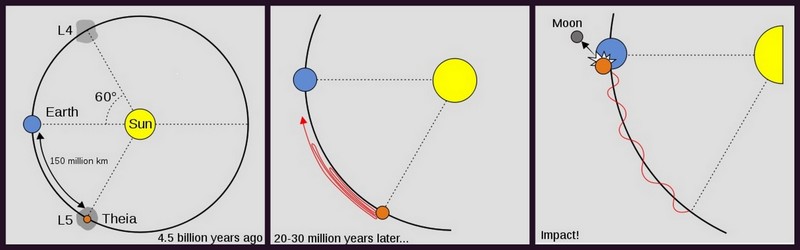
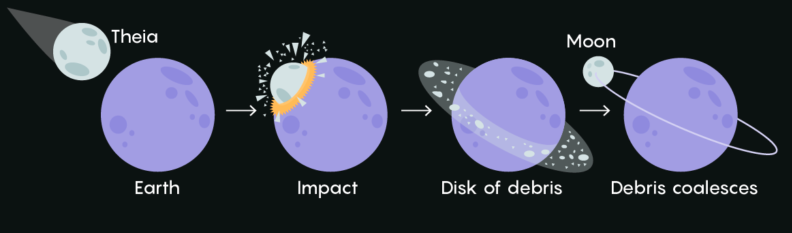
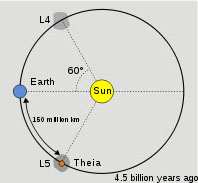
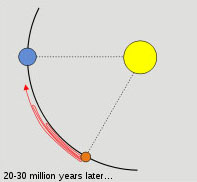
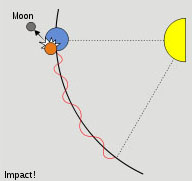
But there may have been one in the early history of Earth!. I will end this blog with a fascinating theory about the origin of the Moon! The theory is called the Giant-Impact Hypothesis. When the Sun and the planets were born, about 4.5 billion year ago, Earth was not alone. It had a Mars-sized sister planet in the L4 (or L5) Lagrange point. About 20-30 million year later, this hypothetical planet, named Theia, possibly disturbed by the other planets, left the L4 region and collided with Earth. It must have been a cataclysmic event From this collision the Moon was born.. Here is the scenario.
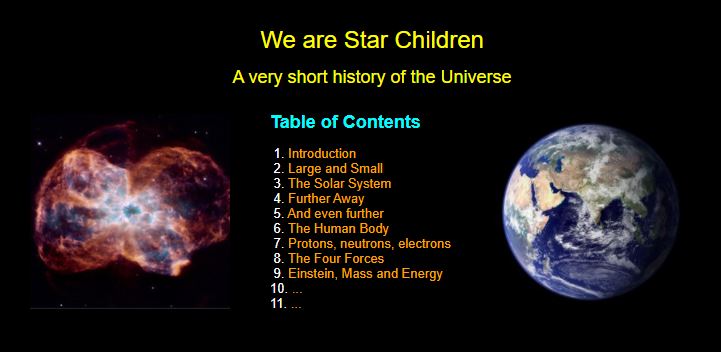
Twelve years ago I started an ambitious project, a series of webpages to explain that we can be considered to be Star Children, in the sense that all the atoms forming our body (with the exception of hydrogen), have been formed in the interior of stars.
The project was too ambitious, here is a screenshot of he small part I managed to complete. It is still available on my website. Click on the screenshot to have a look.
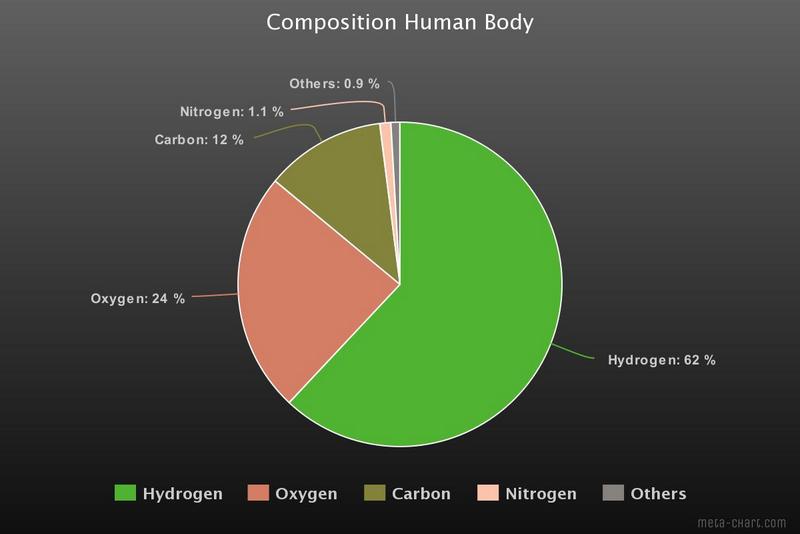
An adult human body (70 kg) contains roughly 7×1027 atoms. Written out a 7 with 27 zeros: 7,000,000,000,000,000,000,000,000,000. That is a lot, actually much more than the estimated number of stars in the observable universe (1023-1024).
Most of those atoms are hydrogen atoms. The human body consists roughly of 60% water and each water molecule contains 2 hydrogen atoms and 1 oxygen atom. Oxygen comes second and carbon third. Together with nitrogen these four elements form more than 99% of the human body. For the graphs I have used data from the Wikipedia article Composition of the Human Body. Most of the graphs you find on the Internet give mass percentages, in that case oxygen takes first place. I prefer a representation in atomic percentages.
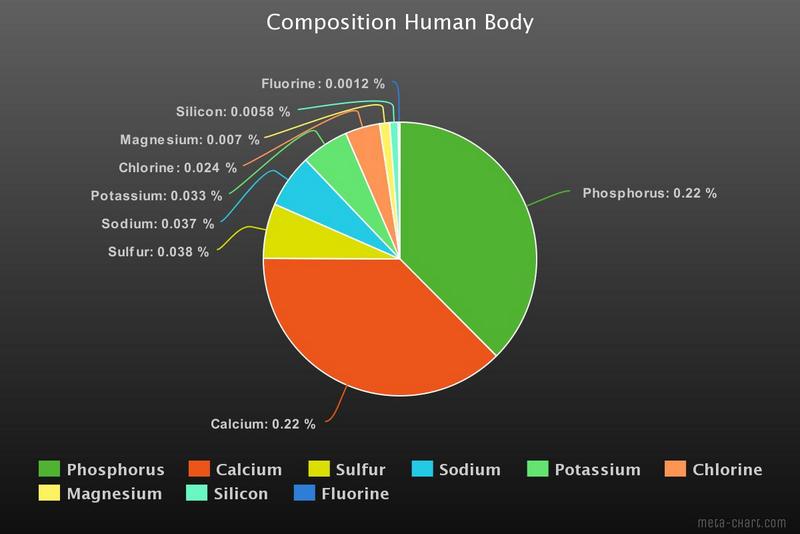
In this graph some of the other elements are shown. About 25 elements are considered to be essential for human life, some in minuscule percentages. For example Cobalt (in vitamin B12) contributes only 3.0×10⁻⁷ %
How, where and when were all these elements formed? The scientific name for the formation of the various elements is called nucleosynthesis.
Let’s start with the beginning, the Big Bang.
About 13.77 billion year ago our Universe came into being. That is the present estimate, with an uncertainty of ± 40 million year. It was unbelievably dense and hot, a “soup” of quarks gluons and photons. Immediately it started expanding and cooling and after a few minutes protons and neutrons could form. Some of these protons and neutrons fused into alpha particles ( two protons and two neutrons) until after about 20 minutes the temperature was too low for fusion.
But still way too hot for (neutral) atoms to form, it was a plasma (protons, alpha particles and electrons). If an electron and a nucleus would combine, the photons would immediately break it up again. Only after ~380.000 year, when the temperature had dropped to ~ 3000 K, electrons could recombine with protons and alpha particles to form H and He atoms. Roughly about 92% hydrogen atoms and 8% helium atoms. (usually mass percentages are given, 25% He and 75% H).
From that time onwards the photons did not interact anymore with matter, the universe was still bathing in an orange glow (3000K) but as the universe kept expanding and cooling, this radiation went from visible light to infrared , microwave etc. It is what we now still detect as the cosmic background radiation at a temperature of 2.275 K. About 1 million year after the Big Bang, the universe was COMPLETELY DARK!
These cosmic Dark Ages lasted for many million years. But small fluctuations in matter density caused gravity to form concentrations of matter. Inside these matter concentrations the temperature was rising until a level (many millions of degrees) that fission became possible again. The first stars were born and there was again light in the universe. Later also galaxies developed and after about 1 billion years the universe was basically like it is now.
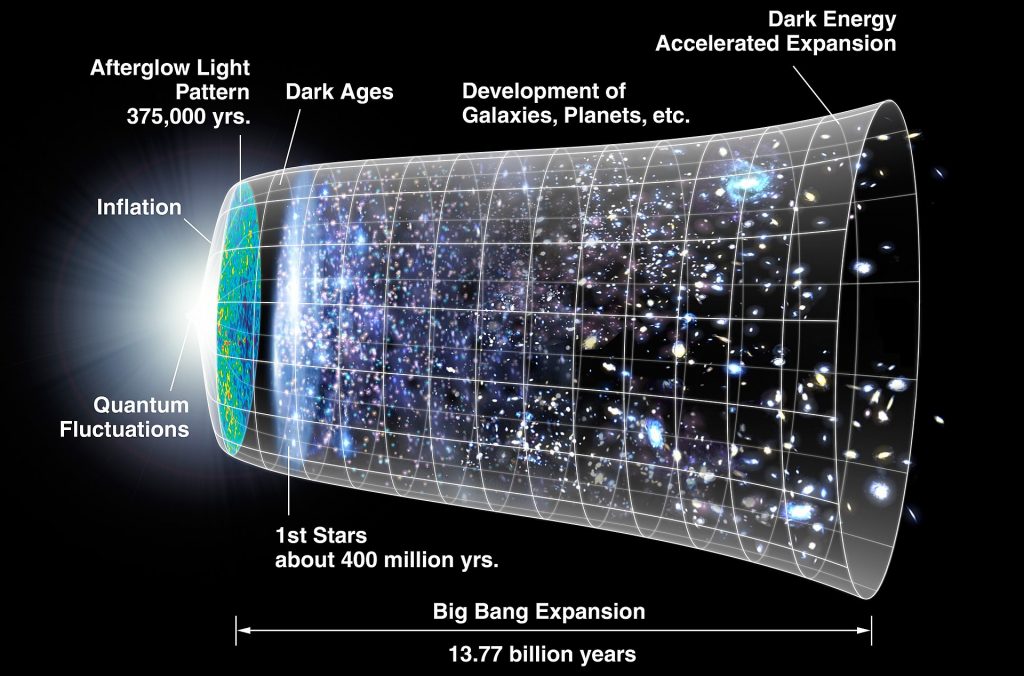
Here is an impression of the development of the universe.
We will now concentrate on the evolution of these stars. First a few general remarks. Basically everything that happens in the universe is the result of four fundamental forces.
The strong nuclear force between nucleons, only active when the nucleons are very close together,”short-range”
The electromagnetic force, ~100 times weaker, but “long range”, holds atoms together.
The weak nuclear force, ~ 1 million times weaker, “short-range”, responsible for radioactivity.
The gravitational force, extremely weak, ~1039 times weaker, “long-range”.
Back to the new-born star. All four forces are active here. The gravitational force tries to contract the star further. The strong force generates counter pressure, by fusing nucleons together, but those nucleons need to move fast (= high temperature) to overcome the electromagnetic repulsion. The weak nuclear force is needed to transform protons into neutrons. Here is how four protons can produce an alpha particle. Other options are also possible.
Our Sun was born 4.6 billion years ago as a relatively small star, a yellow dwarf. At the moment it is still “burning” hydrogen in its core and will continue to do that for another 5 billion years.
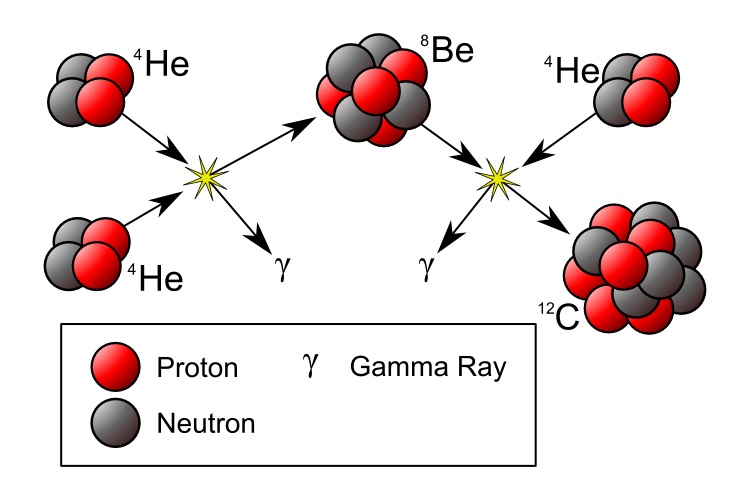
More massive stars will burn a lot faster to counteract gravity. The first stars may have had masses a few hundred times the solar mass, finishing the hydrogen it its core in only a few million years. What next? The core will contract and the temperature will increase. You might expect that fusion would start of two alpha particles into Beryllium (4 protons and 4 neutrons). But there is a problem, that Be isotope is not stable , it has a half live of only 8×10⁻¹⁷ s and decays back into two alpha particles. What will happen occasionally is that during its short lifetime, another alpha particle will collide and form Carbon (6p and 6 n). This is called the triple-alpha process and I will give more details in a separate appendix.
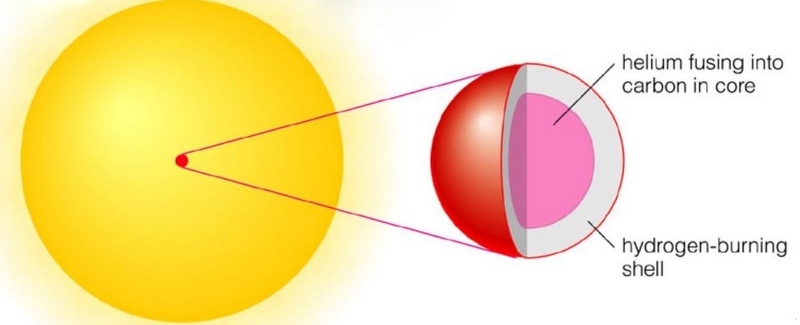
When this helium burning starts in the core, hydrogen burning will still continue in a shell around the core.
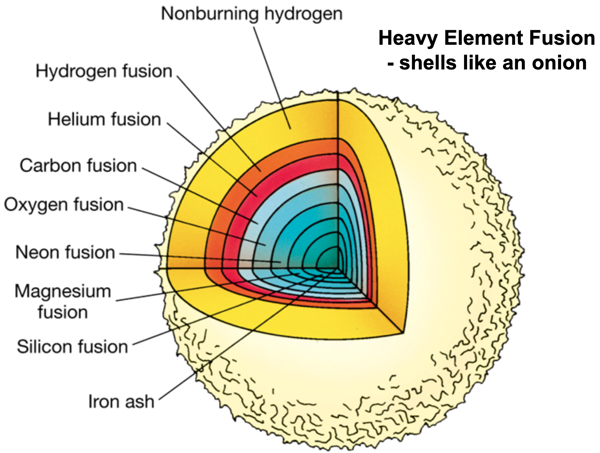
In the next phase, when the carbon core has been formed, carbon nuclei will fuse with alpha particles into Oxygen (8p and 8n) surrounded by a helium burning shell. And so on, Neon, Magnesium, Silicon etc. These fusion processes generate less energy than the hydrogen fusion and when iron is reached the fusion stops, fusion to heavier elements would cost energy! The star looks like an onion with its skins.
When there is no more energy to counteract gravity, the star will die in a spectacular fashion, releasing so much energy that for a short time it can be brighter than a whole galaxy. It is called a supernova. A large part of its mass will be ejected into the surrounding space and in the cataclysmic explosion many of the elements heaver than iron are formed. What remains of the star is a neutron star or a black hole.
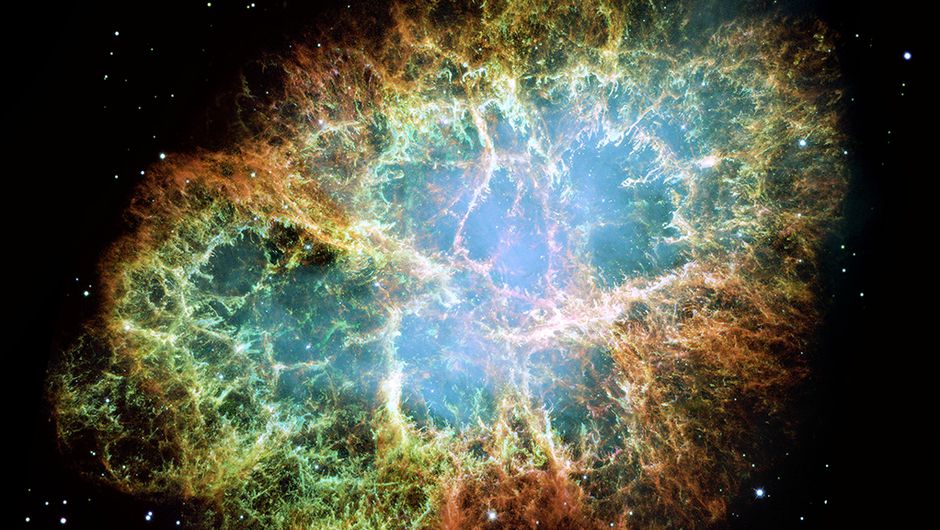
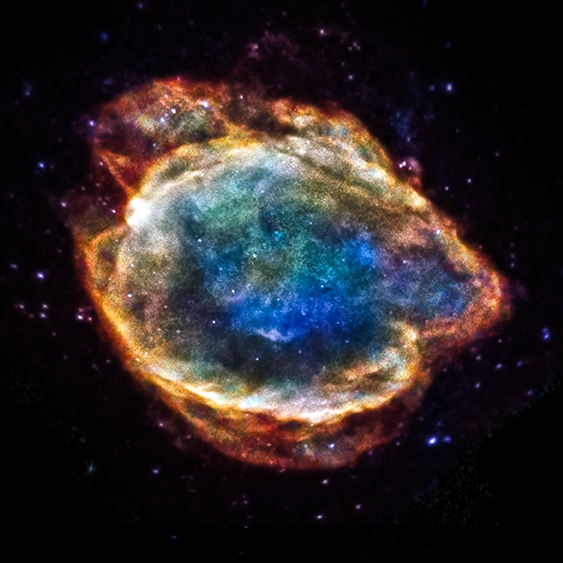
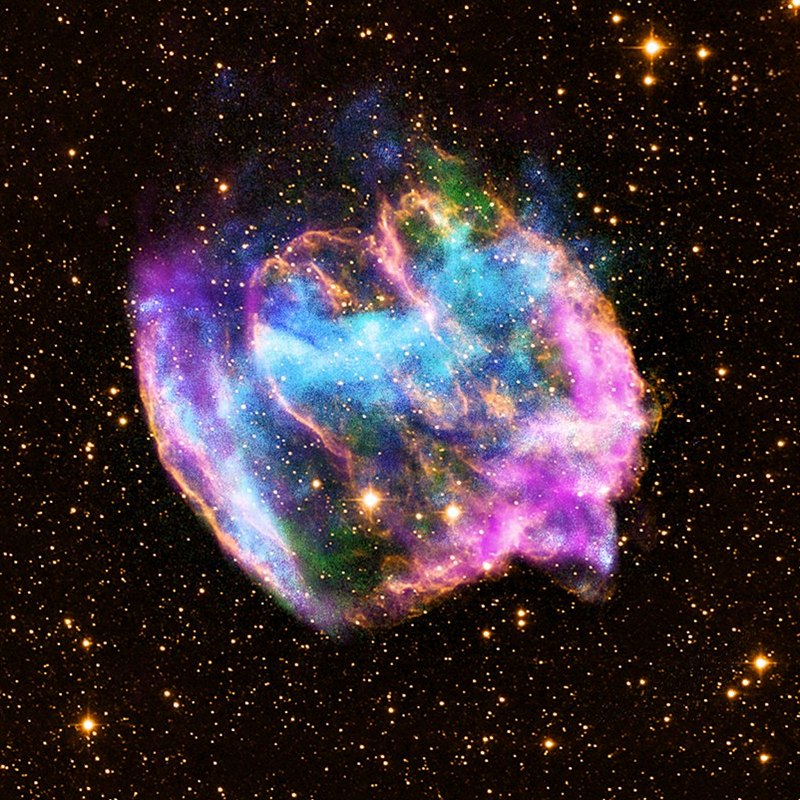
Recently I have written a blog about the Witch’s Broom nebula, the remnants of a supernova explosion. More details in that blog. The most famous of these supernova remnants is the Crab Nebula. The supernova has been recorded by Chinese astronomers in 1054. The center of the nebula contains a neutron star.
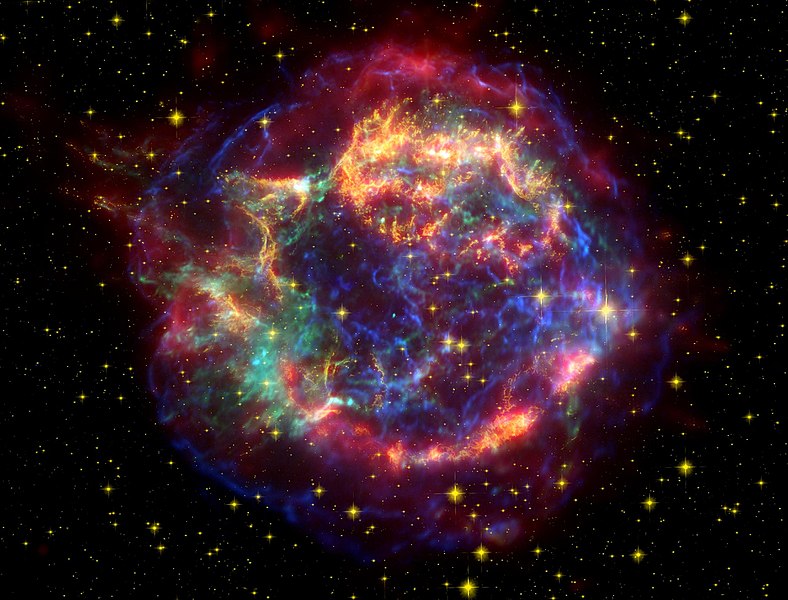
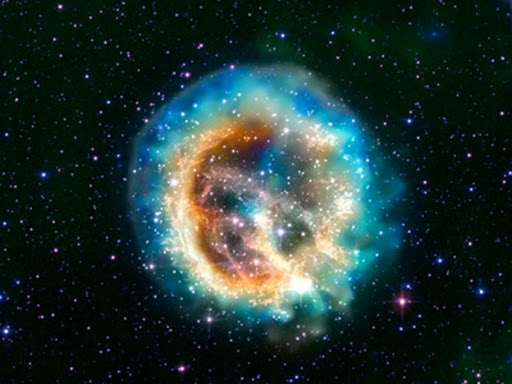
Here are a few more examples. They are all false-color images (see my Witch’s Broom blog). Here is a List of Supernova Remnants.
Cassiopeia A
E0102
G299
W49B
As a result of these supernova explosions the clouds of interstellar gas became more and more “polluted”, no longer consisting of only hydrogen and helium. . It is from these clouds that new stars are born. For example our Sun, 4.9 billion year ago. Still mostly hydrogen and helium but about 0.1 % of the other elements. The big gas planets are also mostly H and He, but the rocky inner planets (Mercury, Venus, Earth and Mars) consist mainly of this 0,1 % other elements, as the hydrogen and helium have been “blown” away by the Sun.
Here is Earth, our Blue Marble, the iconic picture was taken by the crew of the Apollo 17 in 1972. Basically all its atoms have been forged in the interior of stars.
And the same holds for all living creatures, including us. Life on Earth is carbon-based, and each carbon atom has been fused in the interior of a star through the triple-alpha process.
We are Star Children ———————————————–
APPENDIX
The energy that is released when particles are fused is called the binding energy of that particle. For nuclear processes this energy is usually given in MeV (Million electronVolt). 1 MeV = 1.6×10⁻¹³ Joule. An alpha particle has a binding energy is 28.3 MeV. It is this (large) energy which generates pressure to counteract gravity in the interior of stars.
To fuse two alpha particles into beryllium is a different story. You have to add energy (it has a negative binding energy). Not much, 0.092 MeV, but as a result it is unstable, it will decay in two alpha particles. When the British astronomer Fred Hoyle in the 1950s studied the process how elements were formed in the interior of stars, he and others discovered this bottleneck.
During its short lifetime beryllium may fuse with another alpha particle into carbon and that will release energy, 7.367 MeV. The fiery furnace in the core of the star where fusion occurs would contribute another 0.3 MeV. Hoyle calculated that in most cases this “excited” carbon nucleus will decay into alpha particles instead of releasing the extra energy as gamma rays and settling down in its ground state. It could not explain the large amount of carbon found iin the universe.
UNLESS the carbon nucleus would have a so called resonance at an energy of ~7.7 MeV, Think about a soprano who can break a glass by letting it resonate with the frequency of her singing! But at that time no such resonance in the carbon nucleus was known.
Hoyle convinced his friend and colleague William Fowler, an experimental nuclear physicist, to search for such a resonance . And they found this excited level exactly at the energy predicted by Hoyle. This resonance level is now called the Hoyle state,
Was this a coincidence? Without this resonance level, carbon would not have been formed and carbon-based life would have been impossible.
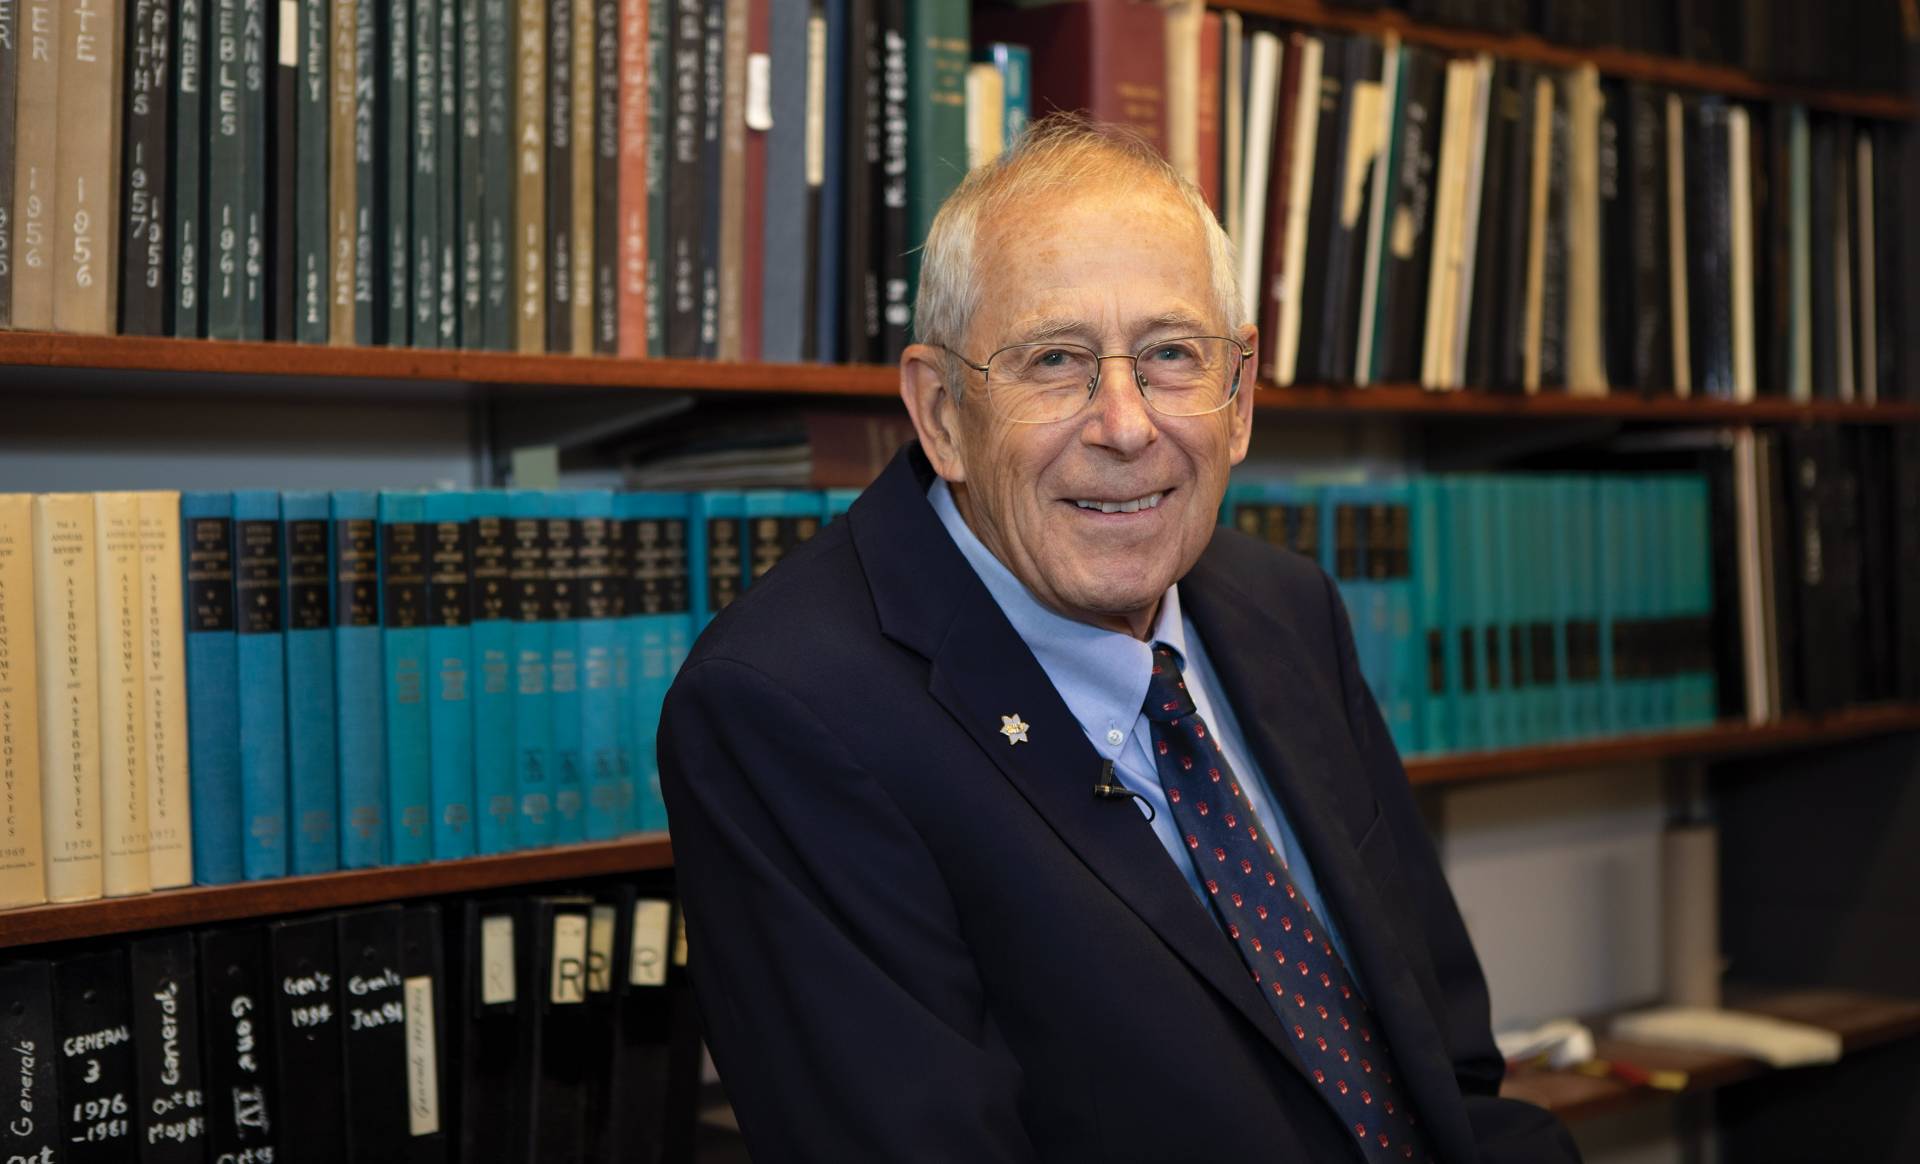
The Nobel Prize for Physics has been awarded this year to Jim Peebles for ” theoretical discoveries in physical cosmology” and to Michel Mayor and Didier Queloz for “the discovery of an exoplanet orbiting a solar-type star”.
In this post I will concentrate on Jim Peebles, maybe in a later post I will write more about the discovery of the other two physicists.
The scientific career of Peebles is closely associated with the Cosmic Microwave Background (CMB) radiation, so I will first explain what it is and how it was discovered.
According to the Big Bang theory, the Universe came into being 13.8 billion year ago. Incredibly tiny, hot and dense, it started to expand, while cooling. In the beginning it was a soup of gluons and quarks, but after a few minutes (!) the temperature had dropped so much that “normal” matter, like protons, neutrons and electrons became stable and even some light elements like deuterons and alpha particles could be formed. But it was still a plasma for many thousand years, until after around 380.000 years the universe had cooled so much that electrons and nucleons could form neutral atoms, like helium and hydrogen. From that time onwards until present photons could travel freely, the Universe had become transparent.
In the 1960’s Dicke and Peebles at Princeton studied this Big Bang theory, which was still not universally accepted at that time. If the Universe started with a “primordial fireball” , remaining radiation of this fireball should still be present. But the Universe has expanded about 1000 times since it became transparent, so the wavelength of that radiation has also increased 1000 times! No longer visible (reddish) light, but microwaves with a wavelength in the order of cm/mm’s, corresponding to a temperature of only a few Kelvin.
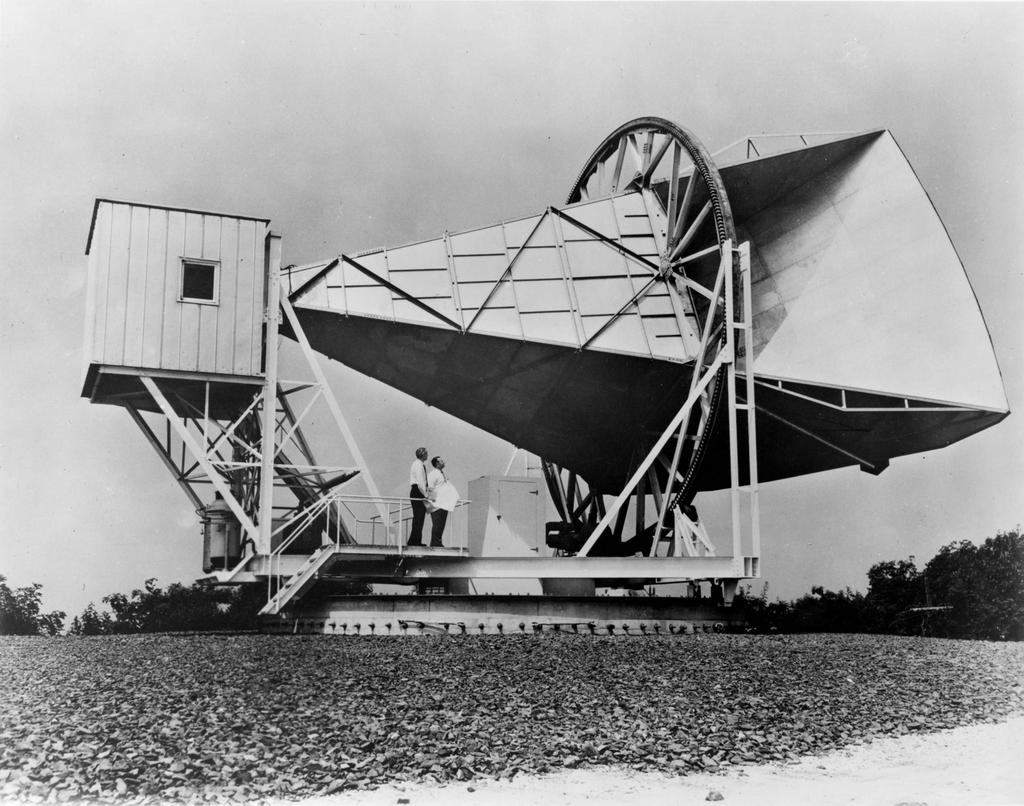
To detect this kind of radiation you need a microwave radiometer , and two colleagues of Dicke and Peebles, Roll and Wilkinson, also at Princeton, were building one. Then they learnt that two scientists at Bell Laboratories, Penzias and Wilson, only 60 km away from Princeton, were actually working wich such a radiometer and had found results they could not explain. Here is a photo of the Holmdel Horn Antenna, used by Penzias and Wilson.
What was it they could not explain? Well, measuring microwave radiation is not easy, because there is much “noise” from many sources, which you have to eliminate or take into account. What they found was that there always remained a background corresponding to a absolute temperature of 3.5 Kelvin. It did not matter which part of the sky they pointed the horn to, and whether it was day or night, there was always this background. They even cleaned the inside of the horn, removing pigeon droppings!
When the two teams came together, the solution was immediately clear. Penzias and Wilson had inadvertently discovered the Cosmic Microwave Background radiation, predicted by Dicke and his team. “Well, boys, we’ve been scooped “, Dicke supposedly said.
In 1978 Penzias and Wilson received the Nobel Prize for Physics “for their discovery of cosmic microwave background radiation” Of course many in the scientific community found that the Nobel Prize should have been awarded to both teams. But (old fashioned) Nobel Prize rules made that impossible, teams can not get the Nobel Prize, only individuals (maximum three).
Roll and Wilkinson continued with their experiment and published the results the next year in the Physical Review Letters: ” Cosmic Background Radiation at 3.2 cm-Support for Cosmic Black-Body Radiation. Searching information for this post, I found a fascinating article, written a few weeks ago by Peter Roll, now retired of course, about his perspective on the 1965 discovery of the CMB. VERY readable, also for non-physicists.
I have written in some detail about the discovery of the CMB radiation because the importance of this discovery can hardly be overestimated. It changed the Big Bang theory from a controversial hypothesis into the standard model for the evolution of the universe. Here is another very readable article in Physics Today, one year after the discovery: A Bang, not a Whimper?
Of course there were still many questions. If the radiation was really thermal, it should have a well-defined spectrum. And it was of course very convincing that the radiation was the same at each point of the sky, but actually there should be minuscule differences, how else could stars and galaxies have formed, if the early universe was completely homogeneous?
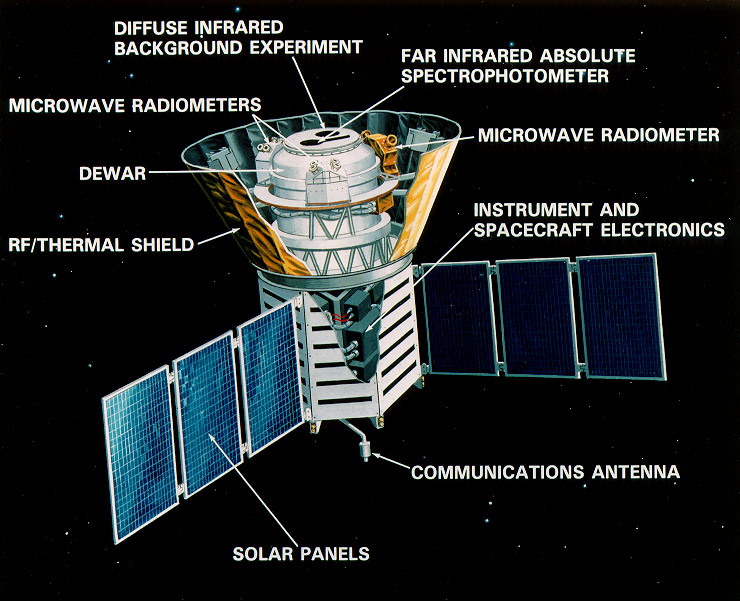
The best way to investigate these questions, was to launch a spacecraft and observe the radiation outside Earth’s atmosphere. And that’s what happened. In 1974 NASA asked for scientific proposals and in 1989 the Cosmic Background Explorer (COBE) was launched. Two main experiments, FIRAS by John Mather, to determine the spectrum of the CMB radiation and DMR by George Smoot to measure the miniscule differences (the “anisotropy”) of the CMB.
Here is the spacecraft. Dimensions (without solar panels) ~ 4,5 x 2,5 m. The experiments are indicated, the Dewar contained liquid helium to cool especially FIRAS to near absolute zero temperature.
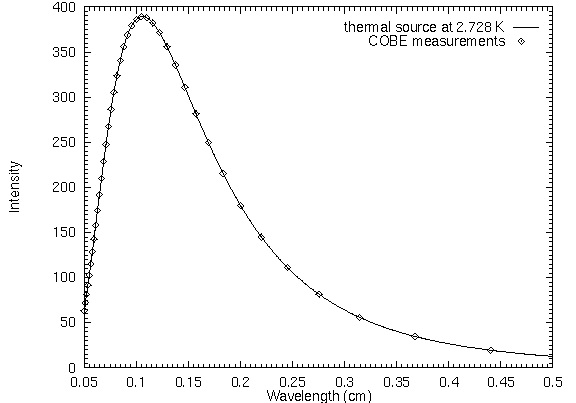
Here are the results. The CMB spectrum fits so perfectly the shape of a thermal source (“blackbody”) that it received a standing ovation when it was presented to the American Astronomical Society in January 1990.
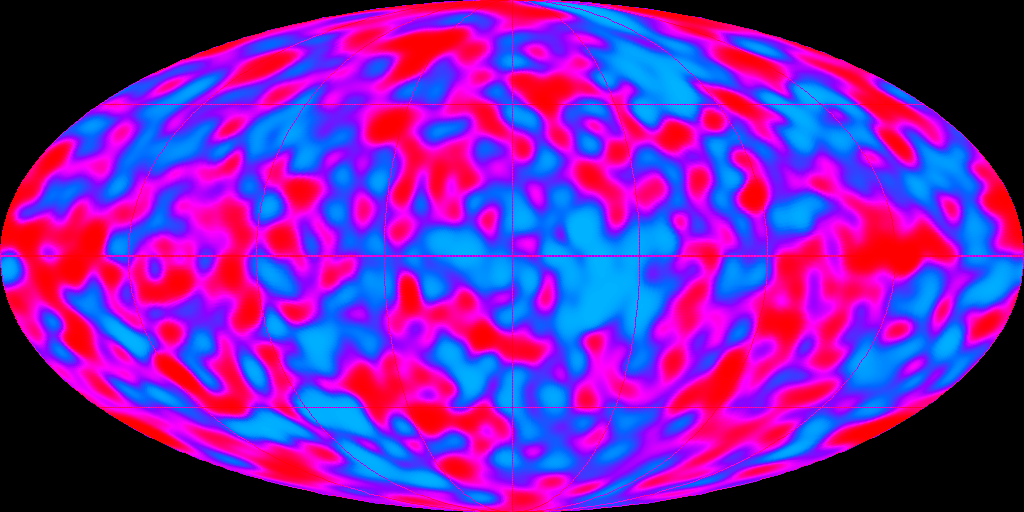
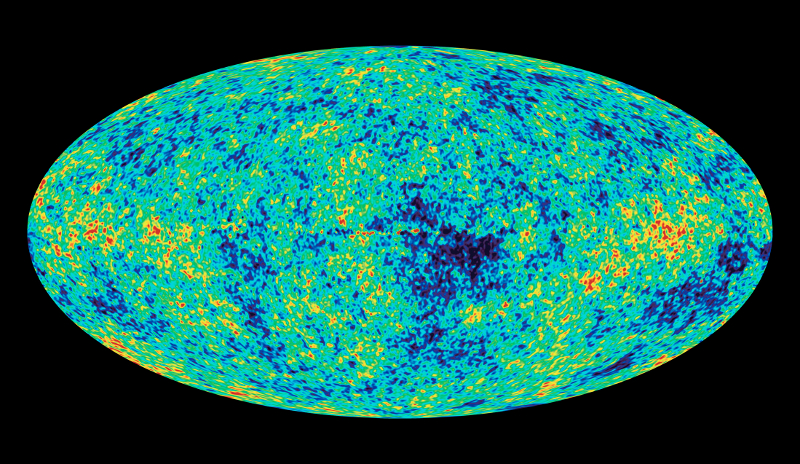
The temperature of the CMB is 2.728 K, but Smoot found indeed tiny differences, depending on the location in the sky. Here is a map of the sky, with the temperature differences indicated in red (slightly warmer) and blue (slightly colder). When these results were published in 1992, they were frontpage news in the New York Times and Stephen Hawking in an interview called it “the greatest discovery of the century, if not of all times”.
In 2006 Mather and Smoot received the Nobel Prize for Physics “for their discovery of the blackbody form and anisotropy of the cosmic microwave background radiation”
Through the CMB we are looking back to the very young universe, 380.000 year old, before stars and galaxies were formed. Exploring these temperature differences, may help us to understand the evolution of the universe. But then a more detailed map of this anisotropy is needed!
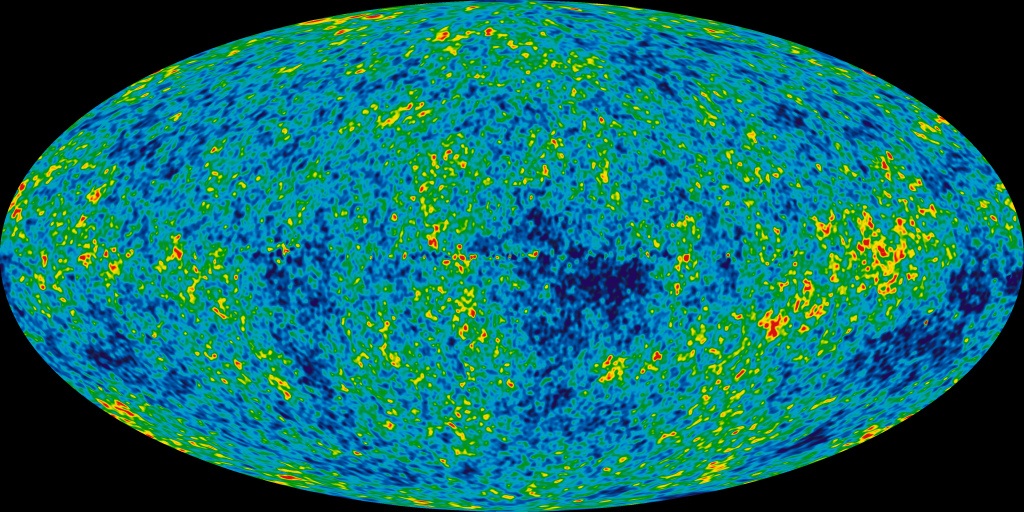
And in 2009 the Planck observatory was launched. The instruments on board were cooled until 0.1 Kelvin, making it the coldest object in the universe..:-) Here is the Planck map, even more detailed.
You may wonder about the shape of these maps. It is called the Mollweide projection and it minimises the distortion you always get when you project a sphere on a plane. For comparison, here is the Mollweide projection of Earth.
There are two other discoveries in cosmology during the past 50 years that I have to mention, before I can finally come back to Jim Peebles and his Nobel Prize 🙂
The first one was the discovery of Dark Matter. In the 70s the American astronomer Vera Rubin studied the rotation of galaxies like the Andromeda galaxy and found that the outer regions of the galaxies were rotating much faster than expected, based on the visible matter of the galaxy and Kepler’s laws. An explanation could be that galaxies are surrounded by a halo of invisible (“dark”) matter. The existence of this Dark Matter has been widely accepted by the scientific community, but we still do not know yet what it is. According to many physicists, she deserved a Nobel Prize for her research, but she never got it. Because she was a woman? She passed away in 2016, Nobel Prizes can not be awarded posthumously. Here is a necrology: Vera Rubin, invisible to the Nobel Committee.
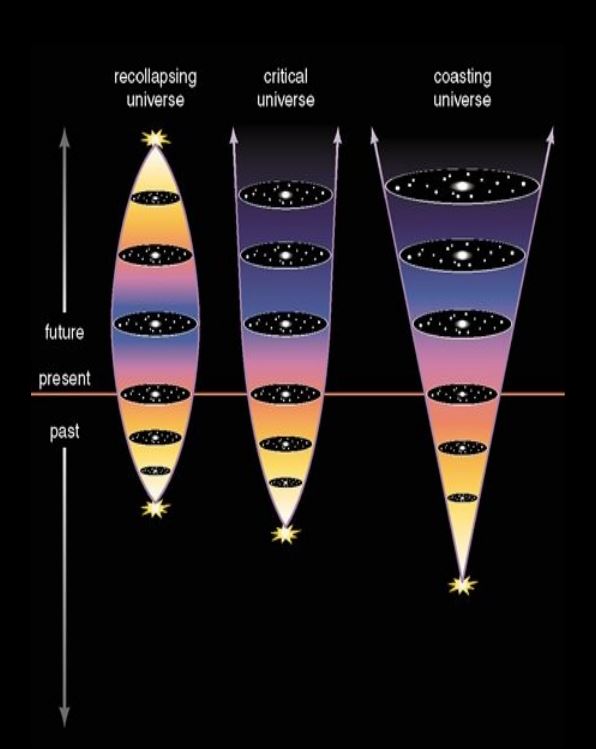
The second discovery was made in the 90s by two teams of astronomers who were studying the expansion of the universe. The Big Bang theory predicted that the expansion would slow down, because of the force of gravity. The crucial question was: will this force be big enough to stop the expansion, followed by a contraction, ending in a Big Crunch, or will the expansion go on forever. The result of their research was shocking: the expansion is not slowing down, but accelerating! There must be a repulsive force, which was called Dark Energy. Also here we do not know what it is. In 2011 the leaders of the two teams were awarded the Physics Nobel Prize “for the discovery of the accelerating expansion of the Universe through observations of distant supernovae”. I wrote a blog about it: Physics Nobel Prize (2011).
So, what did Jim Peebles discover? Nothing actually, and that may have been a reason that he received the Nobel Prize so late in life (he is now 84 year old) as the Nobel Committee has a preference for (experimental) discoveries.
But Jim Peebles rightly deserves the Nobel Prize because he has been instrumental in developing the theoretical cosmological framework for what is called physical cosmology. In 1982 he published a groundbreaking article about a cosmological model with dark matter in it and in 1984 an article in which he added the cosmological constant Λ (now called dark energy) to his model. This model , the Λ CDM model, is at present the standard model of cosmology. For this work Peebles could (should) have been awarded the Nobel Prize many decades ago! Well, better late than never 🙂
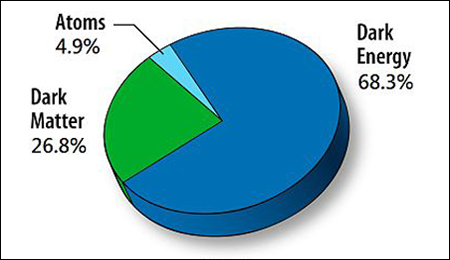
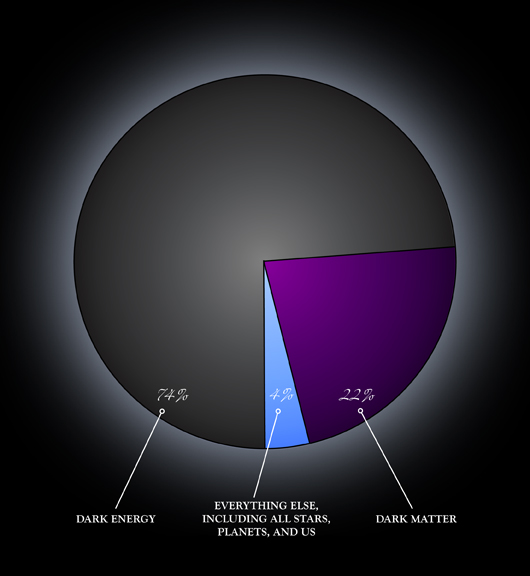
With this Λ CDM model, using the properties of the CMB radiation and other experimental results, it is possible to determine how much normal matter, dark matter and dark energy there is in the Universe. The best fit to the (Planck) CMB data is obtained with the following values:
Atomic matter 4.9 %
Dark Matter 26.8 %
Dark Energy 68.3 %
Probably most of you will have seen this result. Everything we observe around us, our earth, the sun, the planets, the galaxies, it is only ~ 5% of our universe. About the other 95% we know basically nothing. Astonishing and mind-boggling.
Let me finish this post with two images. Below is an overview of the Big Bang expansion. The CMB is seen to the left, called the Afterglow Light Pattern. To the left you see “Inflation” and “Quantum Fluctuations”. The present theory is that in the first ~ 10−32 (!) second, the universe expanded exponentially. I don’t feel qualified to write a post about it, see the Inflation article in Wikipedia.
When the universe became transparent after 380.000 year, there were no stars and galaxies yet, the universe was dark, except for the afterglow! It took hundred millions of years, before the first stars were formed. More info in Wikipedia’s Chronology of the universe.
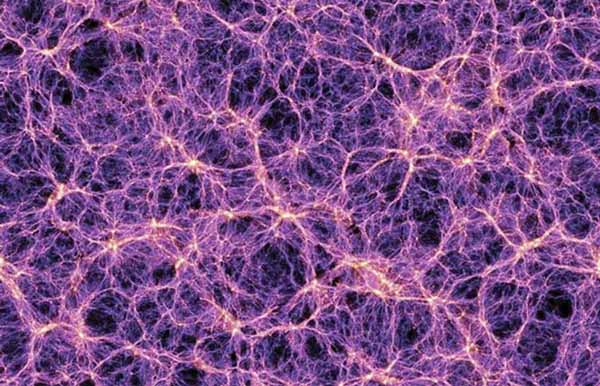
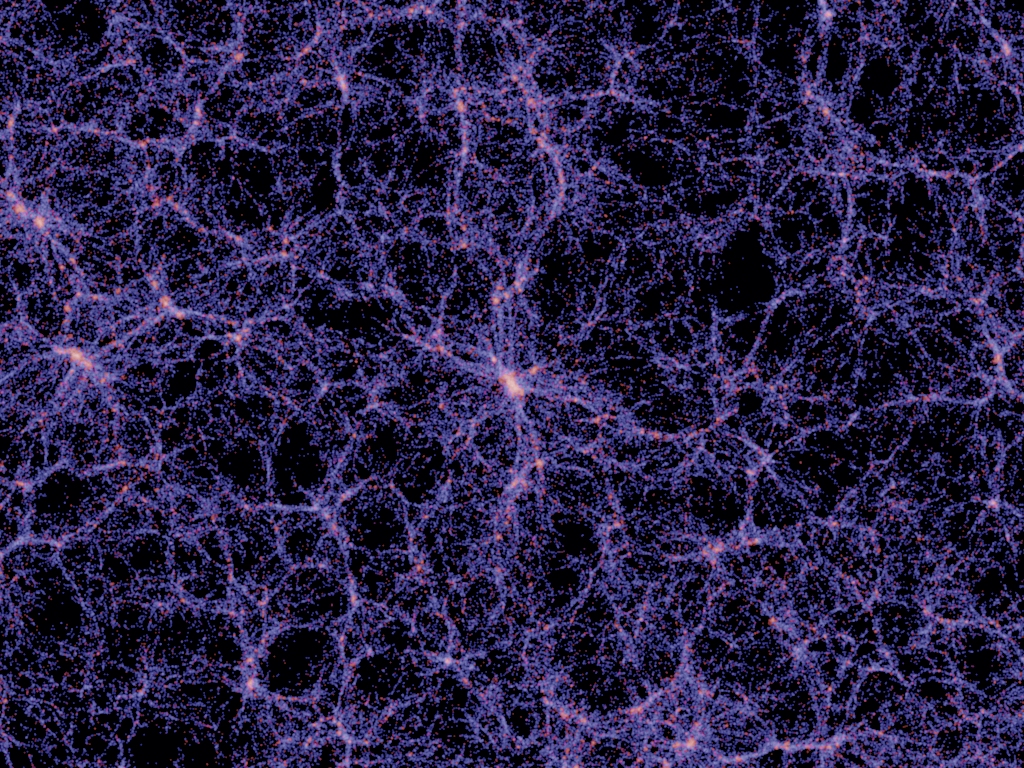
In 1980 Peebles published a book Large-Scale Structure of the Universe and that has always been his primary interest. There are about 200 billion galaxies in the observable universe, are they just randomly distributed? The answer is no, they are part of what nowadays is called the Cosmic Web. They are concentrated along filaments, with huge voids in between. In this artist impression, each light dot is a galaxy. Another mind-boggling image. 🙂 .
How is it possible to extract the values for dark matter, dark energy etc from a map of the sky with minuscule temperature differences?
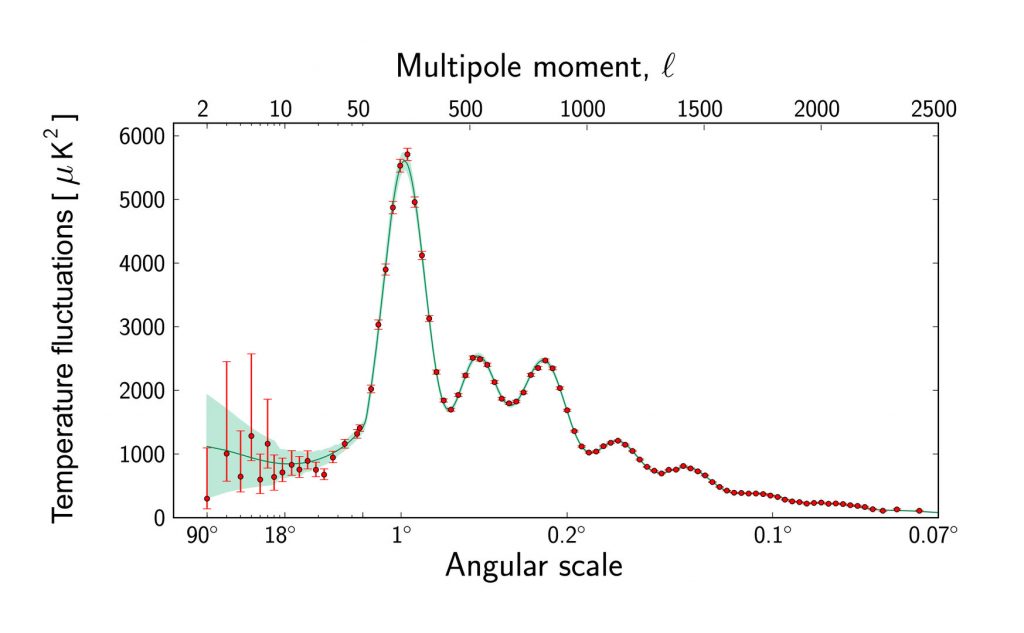
The first step is to “translate” the temperature differences into what is called a power spectrum. The CMB map has cold and warm patches in various sizes. A power spectrum gives the intensity of these patches as function from their (angular) size.
Here is the power spectrum of the PLanck CMB map. The largest temperature fluctuations are found in patches of around 1 degree. Notice that the angular scale runs from left (large patches) to right (small patches). The red dots come from the CMB map. The green line is the best fit from the Λ CDM model, using the parameters given above.
Here is an instructive video, how the different parts of the power spectrum correspond from left to right to increasingly detailed structures.
The calculations are complex and need powerful computers.
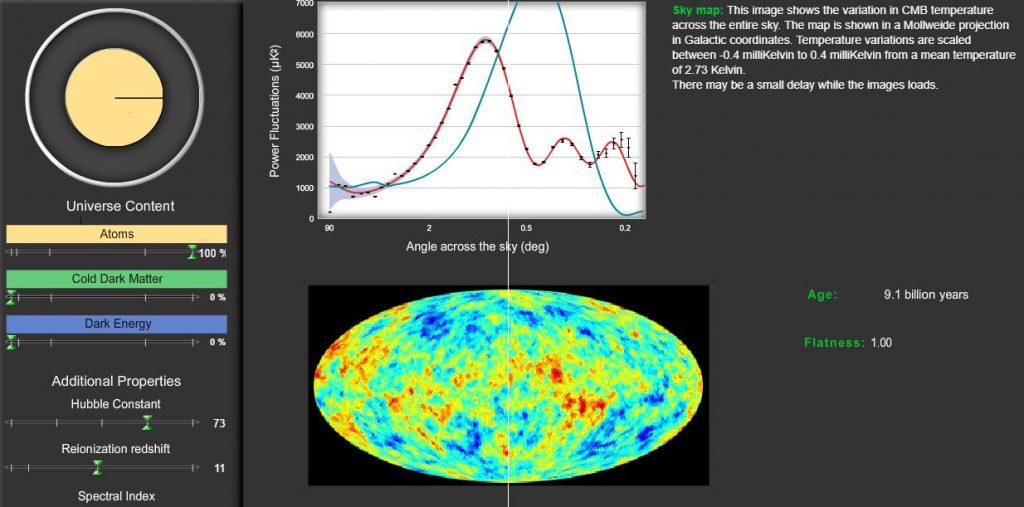
In this simulation: Build a Universe you can play around with the various parameters. To run it on your computer, you need to have Flash installed. Not everybody will have Flash, so I have taken two screenshots. The first one, shows the “fit” for a universe with only normal matter. The second one uses parameters like given above.
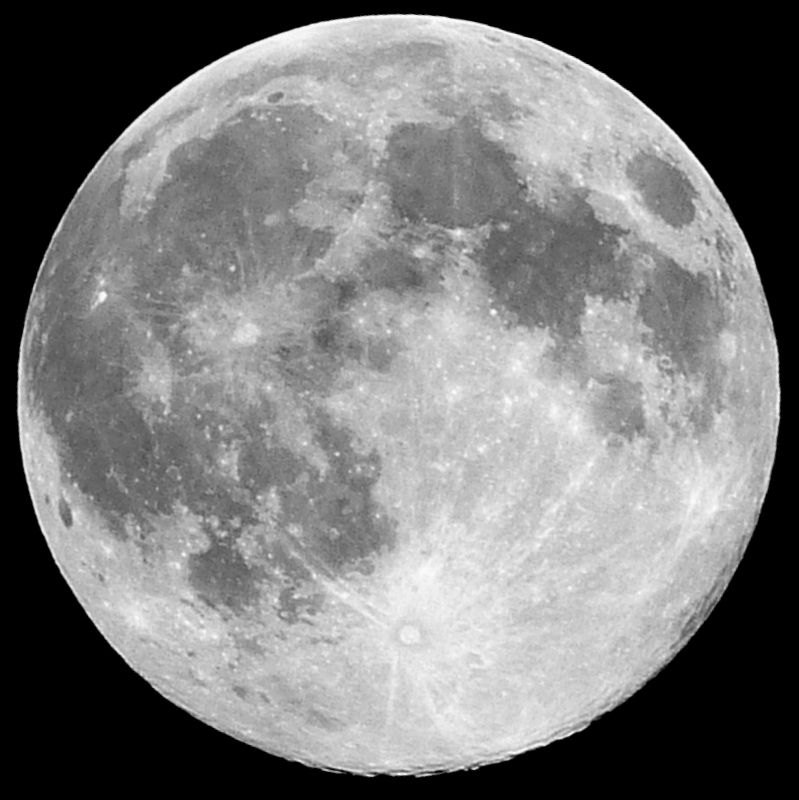
Last week it was full moon, and not just an ordinary one, but a perigee full moon, often popularly called a “Super Moon”. The orbit of the moon around the earth is elliptical, so the distance between moon and earth varies between 363.104 km (perigee) and 406.696 km (apogee). When a full moon occurs at perigee, the moon looks larger and brighter. It’s not a rare phenomenon, 9 September this year will be the next perigee full moon, and June 2013 there was another one. It’s a bit of a media hype.
My friend Chuan took a beautiful picture of this perigee full moon, in the middle of the night, with his point and shoot camera(!), handheld, 24x zoom.
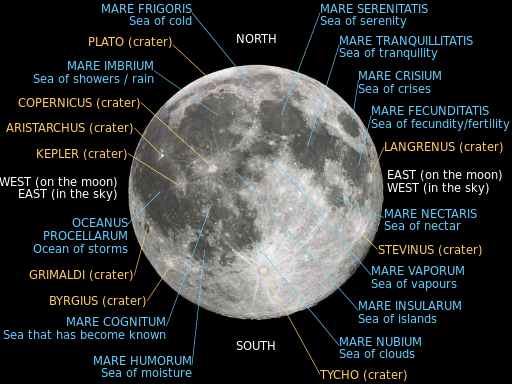
The dark regions are called Mare (Sea) because in the past people believed that there was water on the moon. Actually they are basaltic plains, formed by ancient volcanic eruptions. Huge craters mark the places where meteorites have hit the moon. Here is a map of the moon with the names of craters and seas.
We can see only one side of the moon because the moon is “tidally locked” to the earth, always showing the same face to us. This interesting phenomenon deserves a separate post..:-) So how does the other (“dark”) side of the moon look like? It’s only after the start of the space age that we were able to explore. With a surprising result. Here is the other side of the moon
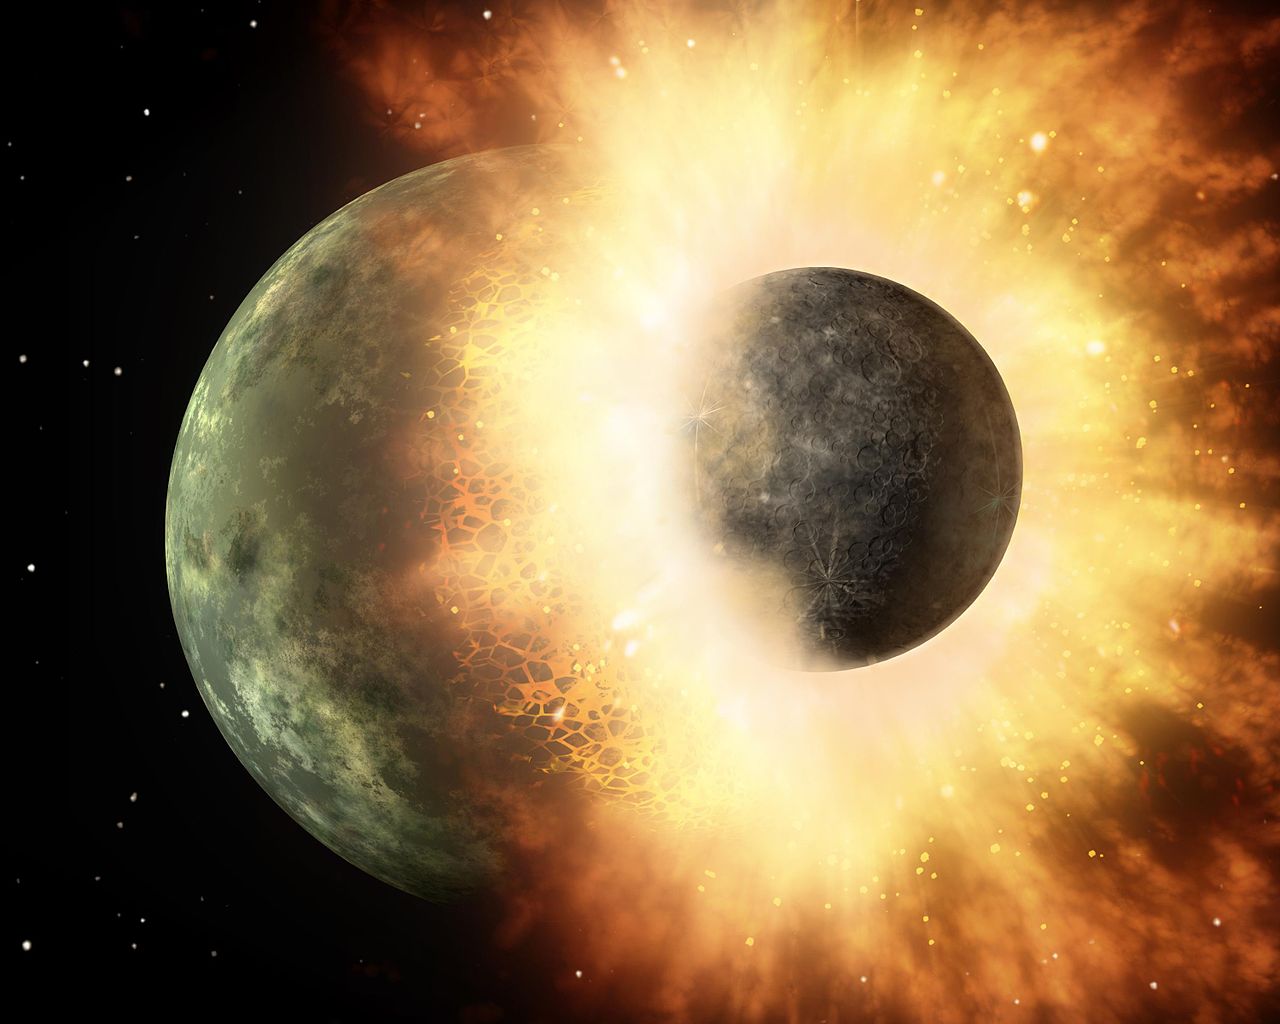
A lot of craters, but no “seas”. Why so different? Which leads to another, more basic question, where does the moon come from? Was it “born” at the same time as the sun and the other planets, ~4.5 billion years ago? Many hypotheses have been formulated, here is the theory that is generally accepted at the moment. It is called the Giant Impact Hypothesis
Not long after the formation of the solar system, there was another planet, about the size of Mars, which collided with the (young) Earth. Here is an artist impression of this collision.
This hypothetical planet has been named Theia, after a Greek goddess, the mother of Selene, the goddess of the moon. The effect of this dramatic collision was that a large part of Theia and Gaia, as the young Earth is sometimes called, melted together, forming the present Earth, but another part of Gaia and Theia was thrown out during the collision and coalesced into the Moon.
So powerful was this collision that the new Moon and probably also part of the Earth consisted of molten magma. The Moon, being smaller, cooled faster, and because of the heat of Earth and the tidal locking, the near side of the moon got a thinner crust than the far side! According to this theory that might be the reason that the near side has had more volcanic activity than the far side. There are many more arguments in favour of this giant impact hypothesis.
Of course the next question is then, where did Theia herself come from? A very promising idea is that this planet might have been formed in about the same orbit as Gaia. In 1772(!) the French mathematician Lagrange studied the properties of rotating systems, like the earth orbiting the sun. He discovered that there exist points in such a system, where other objects can exist in a stable way. There are five such points, nowadays called Lagrange points
In the Lagrange points L4 and L5 the gravitational force of Sun and Earth balance in such a way, that objects will corotate with Earth around the Sun. During the formation of the solar system, mass could have accumulated in for example L5 and formed Theia. Through the disturbance by other planets (Venus for example), this planet could, after millions of years, leave L5 and collide with Earth.
Just skip this last part if you find it too complicated…:-)
But that is long ago, the Nobel Prize 2012 has already been awarded and in October the winners of the 2013 prize will be known!
Yes, this post is long overdue, I know 🙂 Every year I am interested, being a physicist myself, who will get the Nobel Prize for physics and for what . And nowadays often I have no idea what it is about :-(, being out of touch with the modern developments for so long already. So I was quite happy that I understood the importance of the discovery made by Perlmutter, Schmidt and Riess in 1998 that our Universe is expanding at an accelerated rate.
From left to right, Perlmutter, Schmidt and Riess
Of course you have heard about the Big Bang, the primordial explosion that created the Universe, about 14 billion year ago. As a result of this explosion the Universe is expanding and also cooling down. Proof: when we look at faraway galaxies, we observe that they are moving away from us and each other, the farther away the faster they move. And in 1965 the Cosmic Background Radiation was discovered, proof of the cooling down of the Universe.
When I was doing my PhD research, in the seventies, the Big Bang theory was widely accepted. And also that the rate of expansion should decrease with time because of the mutual gravitational attraction between all matter in the Universe. If the Universe contained enough mass, the expansion would finally stop, followed by contraction and ending in what became known as the “Big Crunch” where the whole Universe would again be concentrated in a single point. And might even start again in another Big Bang! An attractive idea in those hippie days!
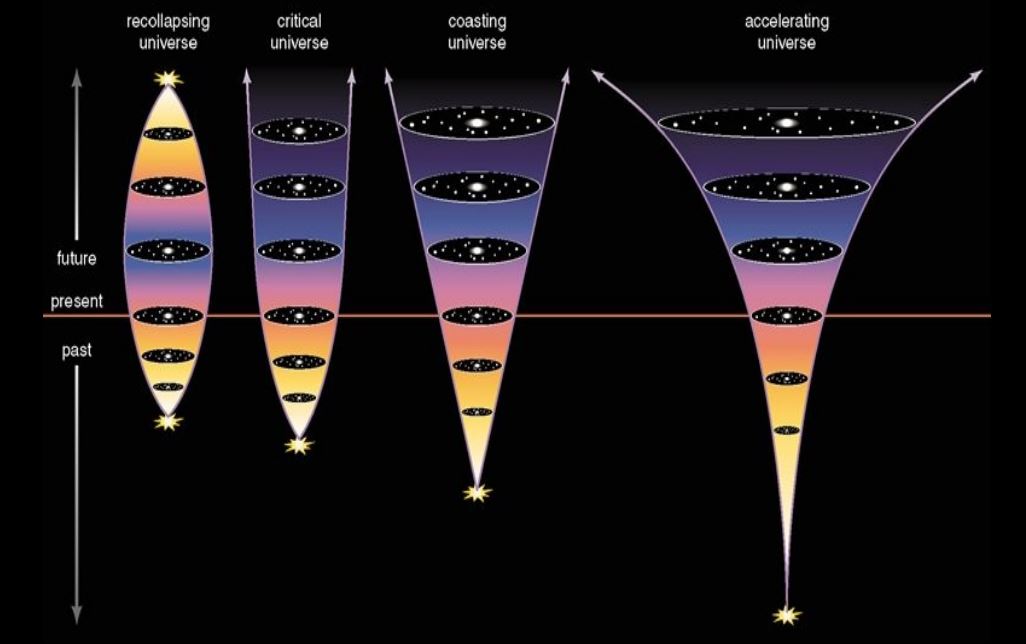
Here are the possible scenarios. In the coasting scenario there is not enough mass to stop the expansion, in the middle one there is just enough mass to stop it (asymptotically), but not enough to reverse the process (as in the left scenario)
The problem was that when you counted all the visible mass in the Universe, there was just not enough to stop the expansion. It was named the “missing mass problem”.
Would it be possible to determine experimentally which scenarios was the correct one? To measure the rate of expansion, you should measure the velocity of very faraway galaxies. Measuring the velocity is not that difficult, you have to measure the Doppler shift. When an ambulance passes you, you will first hear a higher sound of the siren, and a lower sound when the ambulance is moving away from you. For light it is basically the same, here you will see a difference in colour. When a star or galaxy is approaching is, the colour is a bit bluer, when it moves away it will be redder. Measuring the “redshift” gives us the velocity.
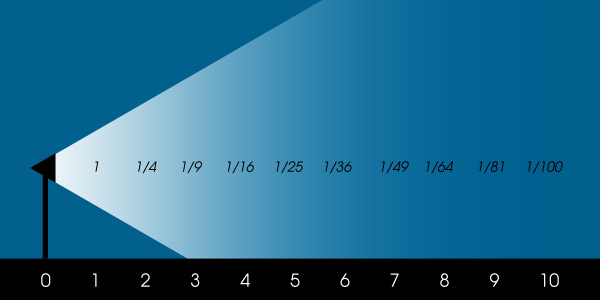
The big problem is how to determine the distance to such a faraway galaxy! The technique used in astronomy is based on the fact that light from a light source becomes more spread out when the distance is larger. Probably every photographer is aware of this “inverse-square law”
So if you know how “strong” the light source itself is, you can determine the distance by measuring the amount of light at that distance. But how do we know how much light a star really produces? In general that is impossible, because you have big bright stars and small, not so bright stars.
What the Nobel Prize winners did was looking at very special events, so-called (type 1A) supernova’s. A supernova is a star that explodes at the end of its life. During a few days/weeks it can produce more light than a whole galaxy. And the intensity of this light is basically the same for each supernova explosion (of type 1A). They are extremely rare events, it is estimated that in our own Milky Way they occur only a few times in a century! But when they occur, they are so bright that they can even be observed in very distant galaxies. And there are so many galaxies.
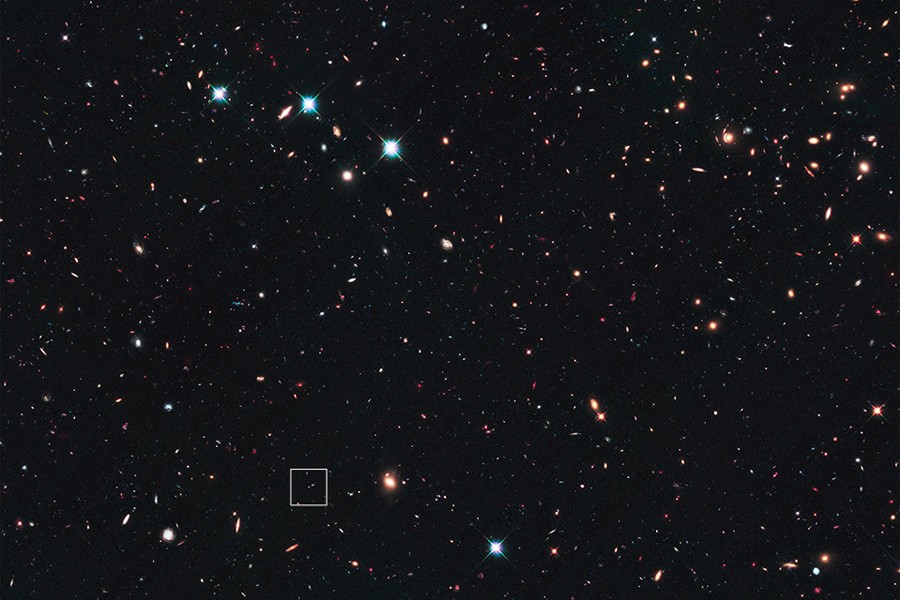
Finally we can now explain the research done by the (competing) teams of Perlmutter and Schmidt & Riess. They looked for type 1A supernovas in distant galaxies and determined the distance and the velocity. To show you how complicated this kind of research is, here is an image of a recent supernova discovery, SN Wilson. In this image a few bright points are stars, but many are galaxies. The tiny square contains the galaxy with the supernova.
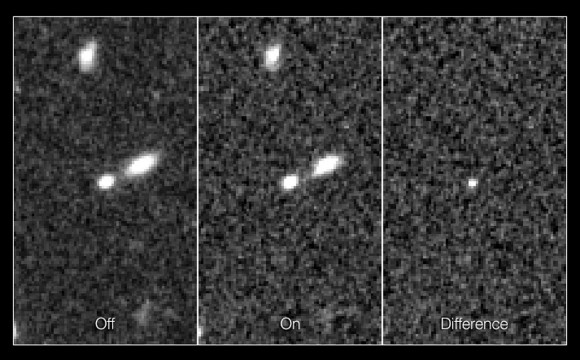
Here are three enlarged images of this tiny square. The galaxy is the round spot in the center. Left image shows the situation before the supernova exploded, in the middle one the supernova has exploded. You don’t see any difference? Let the computer “Subtract” the left image from the middle one and you get the image to the right! Voila, the supernova ..:-)!
These images, taken by the Hubble telescope were taken by the team of Riess in 2010. The distance is 10 billion light year, which makes this galaxy the most distant one, observed until now.
As the light of this galaxy needed 10 billion years to reach us, we observe it now as it was 10 billion years ago! Looking far away means looking in the past. The scientists expected to find that in the past the expansion of the universe would be faster than it is now, as explained in the beginning of this post.
What they actually found, shocked the scientific world: the expansion of the Universe was accelerating . It was so unexpected that it was very fortunate that two research teams came to the same conclusion.
So there had to be a repulsive force, stronger than the attractive force of gravitation. This repulsive force is now named “dark energy” but we still have no clear idea what it is.
It is for this discovery that the two teams shared the Nobel Prize.
The three scenarios, mentioned above are all wrong. It is the fourth scenario, shown below, that we now believe to be correct. There is even a possibility that this acceleration will increase so dramatically with time, that the Universe would end in a Big Rip, where finally, stars, planets, even atoms would be ripped apart.
Much progress has been made since 1998, especially in the analysis of the Cosmic Background Radiation. It has confirmed that there is a repulsive force, now named “dark energy”. It has also confirmed that there is a lot of invisible matter in the Universe, now called “dark matter”. In both names “dark” describes our ignorance, at the moment we just do not know what they are. I am planning to write a separate post another time about this topic.
Let me end this post with an image that gives the distribution of “normal” matter, dark matter and dark energy in our Universe. I have seen this kind of picture numerous times, and I still find it shocking.
The stars, the planets, humans, everything is made of normal matter: protons, neutrons, electrons. We know a lot about it. But it is only 4% of our Universe. About the other 22+74 % we know next to nothing at the moment!
If I could start a new life now, I would choose astrophysics and cosmology as my field of study…:-)
Several images above have been taken from this very interesting set of lecture notes.
A few weeks ago an in international team of astronomers announced the discovery of the largest structure in the universe: a group of quasars extending over a distance of 4 billion lightyear (ly).
Quasars (Quasi-Stellar Radio Objects) were discovered about 50 years ago. They look like stars but are so distant (billions of ly away) that they can not be stars. Now we know that they are active nuclei of galaxies, surrounding a massive black hole in the center. Billions of ly away means that we observe them as they were billions of years ago when the universe was still young.
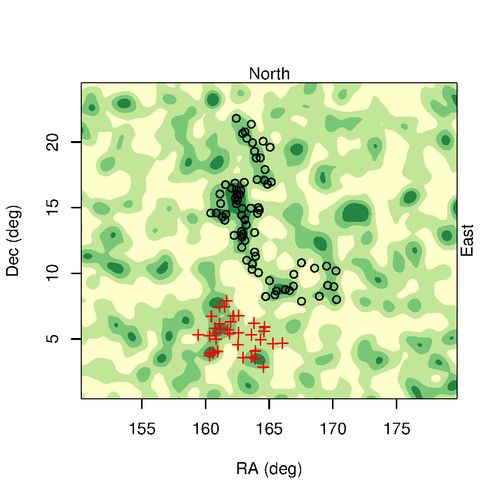
More than 200.000 quasars are known at present. Some of them occur in (large) groups, called LQC‘s.The group that has now been discovered has 72 members (the black circles in the image). The red crosses form another, smaller group.
So, why is the discovery of this large group of quasars so exciting? To make that clear, we have to talk about the cosmological principle and the large-scale structure of the universe.
Long it has been thought that the Earth was the center of the Universe. Then it was discovered that Earth is one of several planets orbiting a star, the Sun. It is the blue marble in the image below. It is not in scale, light needs only 8 minutes to travel from the Sun to Earth, and more than four hours to reach the outermost planet Neptune.
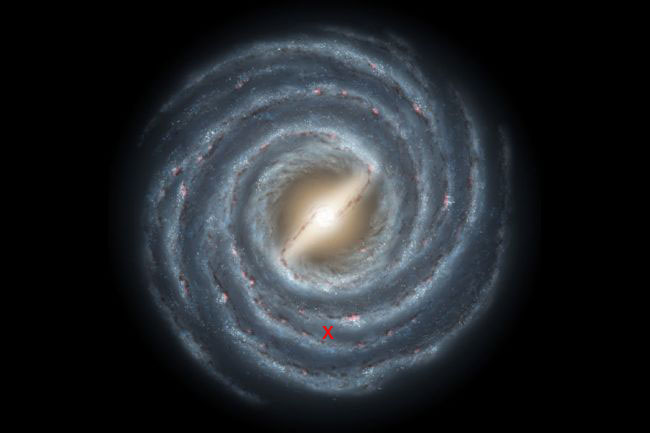
Is the Sun the center of the Universe? No, the Sun is one of several hundreds of billions of stars in our galaxy, the Milky Way. Some of you may have seen the Milky Way on a cloudless clear night far away from cities, as a white band of light across the sky. Here is an artist impression of the Milky Way as seen by an observer from outer space. The approximate location of our Sun has been indicated with a red cross. The diameter of the Milky Way is about 100.000 ly.
Is then the Milky Way the center of the Universe? Again negative! Our Milky Way is just one of hundreds of billions of similar galaxies. The scientists now think that the Universe has no center! From each location and in each direction the Universe looks the same, if you observe it on a sufficiently large scale. This is called the Cosmological Principle
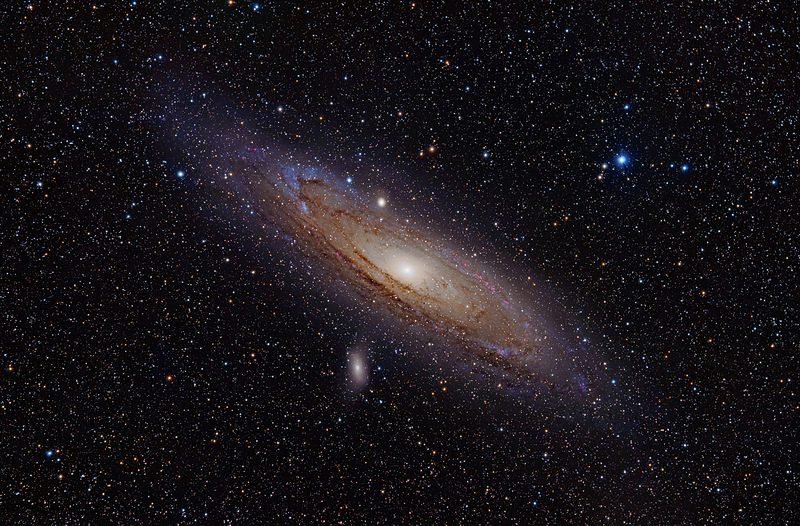
So, what is a sufficiently large scale? If the galaxies would be randomly distributed in the Universe, we would not need to zoom out further. But that is not the case! Our Milky Way is a member of a group of more than 50 galaxies, bound by gravity. It is called the Local Group. Most of the galaxies in this Local Group are small ones, with the exception of our neighbour, the beautiful Andromeda galaxy.
Andromeda is bigger than the Milky Way, may contain one trillion stars and is located at a distance of 2.5 million light-years from our galaxy. Here is a “3-dimensional” sketch of the local group.
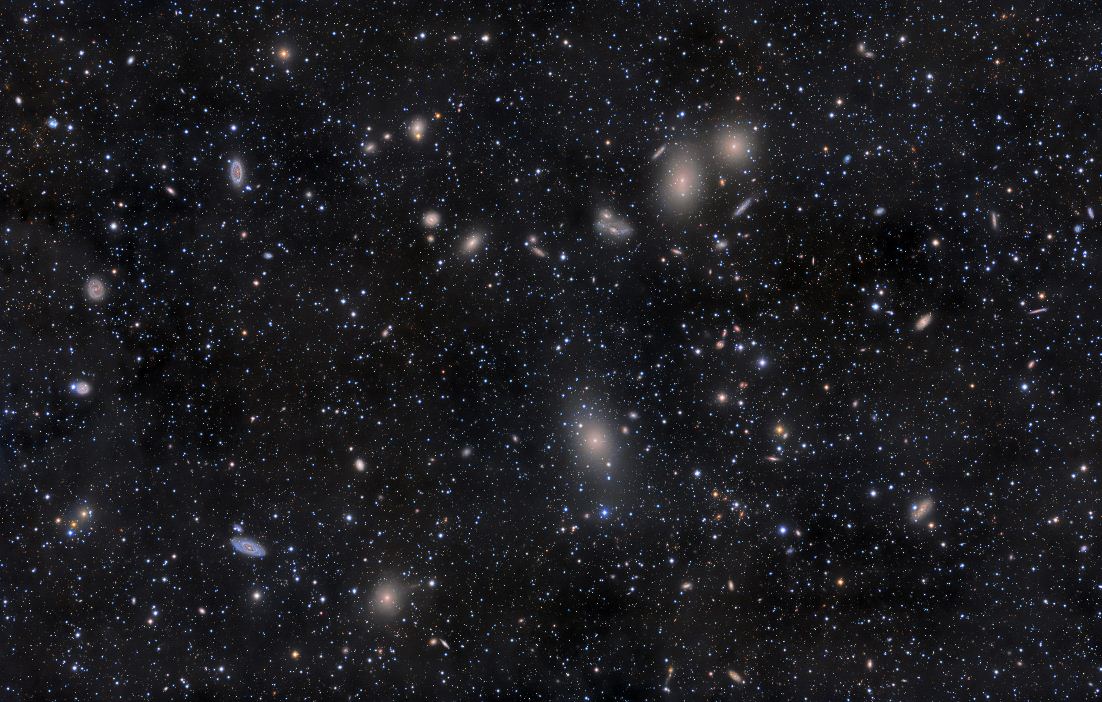
The size of the Local Group is in the order of 10 million ly. Many more of these galaxy clusters exist, for example the Virgo Cluster, much bigger than our Local Group, consisting of more than 1000 galaxies, at a distance of 54 million ly.
Here is the Virgo Cluster. All the fuzzy blobs are galaxies, the light points are stars in our own Milky Way. Click on the image to enlarge it and take a few minutes to think about the meaning of life..:-)
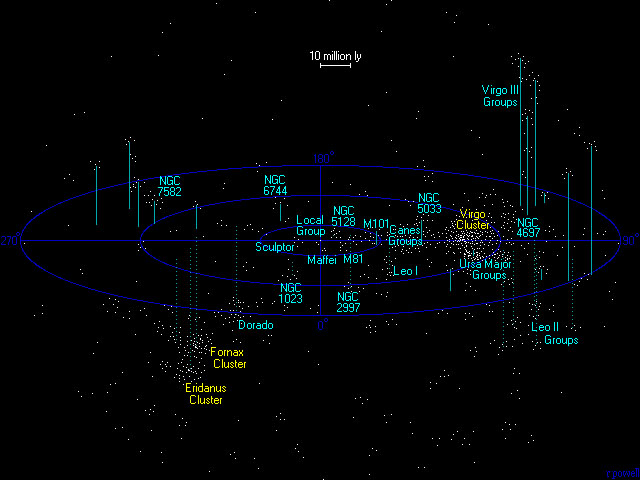
We still have to zoom further out. Our Local Group, the Virgo Cluster, the Fornax cluster, the Eridanus cluster and about 100 more are part of an even larger collection, the Virgo Supercluster . Here is one more “3-dimensional” sketch of this supercluster.
You will see the Local Group in the center, the Fornax and Eridanus clusters and many more. We are talking now about a size of more than 100 million ly already!
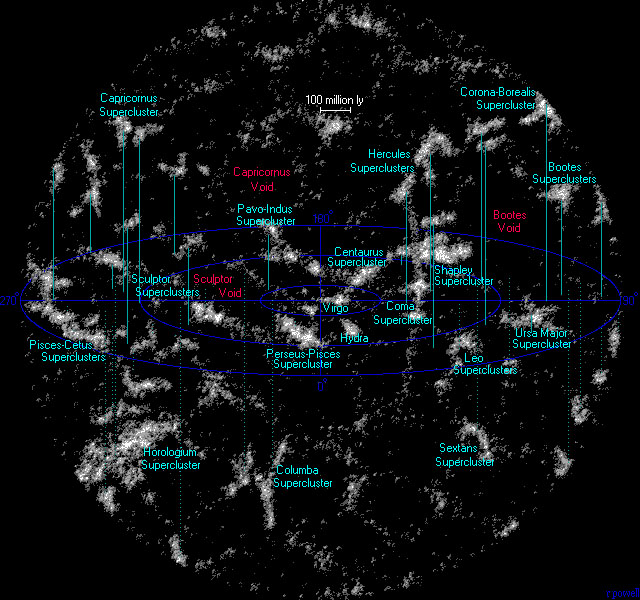
Many more superclusters have been discovered. Could it be that these superclusters of galaxies are randomly distributed in the Universe. Let’s zoom out one more time! The image below shows the superclusters around us within a distance of 1 billion ly. So the width of this image is 2000 million ly.
Obviously this is not a random distribution. Clusters and superclusters are aligned along filaments filaments, with in between large portions of space almost without any galaxies. It looks like a kind of foam-like structure and is sometimes called the Cosmic Web. In the center you notice the Virgo supercluster. Keep in mind the zooming out steps we have made to reach here! Earth → Sol → Milky Way → Local Group → Virgo Cluster → Virgo Supercluster → Cosmic Web.
Do we need to zoom out more? According to the present cosmology theories: NO. Computer simulations starting from right after the Big Bang show that this foam-like structure on a scale of hundreds of millions of light-years is to be expected. Starting point for these simulations is the measured Cosmic Background Radiation CMB), as depicted in the image below.
To explain the relation between this CMB image and the large-scale structure asks for another post…:-). Basically the Standard model of Cosmology is used, including the effects of Dark Matter and Dark Energy. Here is a typical result of such a simulation. The image has a width of 1500 million ly The bright nodes represent Superclusters. You will notice strings of galaxies and voids, quite comparable to the real Universe. At this scale, the Universe looks basically everywhere the same.
We started this post with the discovery of a group of quasars extending about 4000 million ly. Quasars are nuclei of galaxies, so in the terminology used above, they would form a “cluster”. But a cluster of this size would not fit in the above image at all!
This explains the excitement among astronomers and cosmologists. Is the Standard Model of Cosmology wrong?
About three months ago CERN has announced the discovery of the Higgs boson, a.k.a. the God Particle. Several of my friends have asked me if I, being a physicist, could explain what it was all about. I tried, but it was not easy.
Here is another attempt…:-)
Let me start with an overview.
In the 19th century it became increasingly clear that matter is composed of molecules, and that molecules themselves are composed of atoms. Only a limited number of different atoms exists, ninety occur in nature, quite a few more have been made in laboratories. Imagine the tremendous simplification, everything around us is composed of these building blocks!
The periodic table of elements. Uranium (92) is the heaviest element found in nature. Promethium (61) and Technetium (43) are radioactive and not found in nature, giving a total count of 90 elements occurring naturally.
A monumental breakthrough took place in the 20th century, when it was discovered that atoms themselves consisted of only three (!) elementary particles, protons, neutrons and electrons. Protons and neutrons in the nucleus of the atom with electrons orbiting around this nucleus. Just a matter of numbers. Carbon with 6 protons and 6 neutrons in its nucleus and 6 electrons around this nucleus. Add one of each, and you get Nitrogen, do this again and you get Oxygen.This amazing simplicity was one of the reasons I decided to become a physicist. Even a nuclear physicist..:-)
Actually two more particles had to be added to the list. Light also consists of particles, called photons. And some of the elements are not stable but radioactive, the nucleus can send out an electron and at the same time another particle, called neutrino. Everything controlled by four forces. The strong nuclear force, keeping the protons and neutrons in the nucleus together, the electromagnetic force, keeping the electrons in orbit, the weak nuclear force, responsible for the radioactivity and, finally, the force of gravitation.
But this is not the end of the story, soon it became more complicated again! In cosmic radiation, and also in laboratory experiments (using powerful accelerators to let elementary particles collide), new particles were discovered. Not stable, often only living for split seconds, before decaying in other elementary particles. They were named muons, pions, hyperons, a confusing multitude.
It was discovered that protons and neutrons were actually NOT elementary particles, but that they were composed of “quarks”. Not just one, but several families of quarks. Bound together by “gluons”. And the electron and the neutrino were accompanied by other particle families, the muon electron, the tau electron, with corresponding neutrino’s. The strong nuclear force is actually the force between the quarks, with three quarks forming a proton or a neutron.
It has also been discovered that the elementary forces are carried by “force particles” and that the photon is actually the force particle of the electromagnetic force. One of the big successes of the last decades, was the experimental observation of the “weak nuclear force” carriers, the W and Z bosons.
All these experiments lead to what is now called the Standard Model. Three families of quarks, three families of ‘electrons’, three elementary forces with their force particles. This leaves out until now gravitation. That is actually a big problem, but we will not discuss it here
The Standard Model. Gravity is not taken into account. There are three quark families (up-down), (charm-strange) and (top-bottom). And three “lepton” families, electron, muon and tau, with their corresponding neutrinos. Finally the force particles, photon, gluon and the (W,Z) bosons
All the particles in the picture above have been “observed”. Observed in quotes, because these particles are so short-lived that their existence must be concluded from the traces they leave behind when they die…
Much more complicated than the simple “proton-neutron-electron” model, but definitely one of the most impressive results of modern physics.
One problem remains. All these particles, the quarks, the leptons, the force particles, have mass. Some are heavy like the quarks, some are light like the leptons, the photon has no mass, the neutrinos almost nothing. Why?
In 1964 Higgs and a few others came with a theory. There might exist another force field, permeating the universe, acting as a kind of “syrup”, slowing down other elementary particles and in that way giving them inertia ( = mass!). But if that field existed, it should have its own force particle, the Higgs boson. Nicknamed the God particle, because it gave mass to all the other particles.
The theory was widely accepted, so the search for the Higgs boson was on. A fierce competition resulted between CERN and the Fermilab in USA.
It now looks like it has been found. With a mass about 130 times the mass of the proton. And so short-lived that I have not even been able to find an estimate on the Internet. So you have to look at the traces it leaves behind when it dies. Here is an artist impression.
And here is a picture of the experimental setup at CERN (the ATLAS experiment) Try to spot the human figure in the picture!
This is ATLAS, one of the four experiments at the Large Hadron Collider of CERN.
Is our understanding of the physical universe now complete? No way!
As mentioned before, there is still the problem left to combine the Standard Model with gravitation. Maybe string theory, but not everybody is convinced that this will be the solution.
There is a much bigger challenge. During the last decades it has become convincingly clear that there has to be more in our universe than quarks, electrons, photons, etc. Let’s call this “normal matter”. From what we know about the Big Bang and from the way our universe is expanding after the Big Bang, we now are sure that there are two more constituents of our Universe. There has to be “Dark Matter“, until now invisible. And there has to be “Dark Energy“, a repulsive force that actually accelerates the expansion of the Universe. That’s about all we know at the moment.
A small correction to the Standard Model? Absolutely not! Here is the present estimate. Normal matter takes only 4% (!). The rest is basically unknown at the moment!
We know a lot about the 4% normal matter and next to nothing about the rest!
A sobering thought. But also exciting. There is still a lot to discover and explore in our physical universe. And for the ambitious among you: a lot of Nobel Prizes to win!
Here is finally part 2. My apologies for the long delay.
Quite a few of you gave their opinion about the question “Are we alone or not”.
Not surprisingly most ‘votes’ went to “We are not alone”, same as in the poll at the end of the Great Debate video.
My own opinion?
It will be wonderful and fascinating if (intelligent) life is found elsewhere in the universe, but personally I think we are alone.
Mind you, that is not arrogance, I would be more than happy if even primitive life is found elsewhere!
Let me explain why I have become (recently) more skeptical about life elsewhere in the universe.
In discussions about the probability of extraterrestrial life, you will often encounter the Drake equation.
In 1961 Frank Drake tried to make an educated guess about the number of intelligent civilisations in our own galaxy, the Milky Way.
He started with the (huge) number of stars in the Milky Way, then asked questions like: “how many stars will have planets”, “how many planets will be ‘habitable'”, “what is the chance that on such a planet (primitive) life will develop”, “what is the chance that intelligent life will evolve”, and several more of this kind of questions.
In his original estimate Drake comes to a number of about ten planets in our Galaxy at this moment, with intelligent, technologically advanced civilisations.
Many of the factors in the Drake equation are the result of guesswork.
For example, one of the points of discussion in the “Great Debate” is about the chance that intelligent life will evolve from primitive life. Drake’s estimate was 1 %. Marcy in the “Great Debate” thinks it might be close to zero. “Maybe we humans are just a freak evolutionary incident?”
However, both Werthimer and Marcy agree: “primitive life will be teeming in the Universe.”
Drake estimated the chance that life will develop on a habitable planet as 100%!
And Michio Kaku, an American ‘science communicator’, who always enjoys being in the limelight, goes even further: “The Laws of Probability Tell Us That the Universe Should Be Teeming With Intelligent Life Forms” Elsewhere he writes (foolishly, IMHO) about a 100% probability!
Well, if they are right, why has until now no evidence of life been found on Mars?
A few days after my first “Are we Alone” mail, I sent you a short email about the exciting discovery of a habitable planet, orbiting Gliese 581, a red dwarf star at a distance of 20 lightyear from the sun.
Here is the picture again. Planet g is causing the excitement. The blue band is the habitable zone.
The concept of a habitable zone is based on the assumption that you need liquid water for the development of life. The (surface) temperature of a planet should not be too low or too high. For a (cool) red star like Gliese 581, this zone lies much closer to the star, than for a hotter star like our Sun.
Of course you can think about more exotic forms of life, based on silicon, ammonia, etc. Click here for a detailed discussion.
Now, when you look at the picture above, you will notice that both Earth and Mars are orbiting in the habitable zone of the Sun.
The Viking and Phoenix missions to the Red Planet had as one of their main targets the search for life on Mars, and I am sure that many scientists were hoping, or even convinced that evidence of life would be found. So was I.
But “nothing” has been found yet. Of course more exploration is needed and quite a few new missions have been planned.
Still it is disappointing and personally I believe now that the chance that life will develop on a habitable planet, might be small, maybe even very small.
Sure, the Miller-Urey experiments have shown that it is “easy” to synthesize amino acids, the building blocks of life, when the conditions are right.
And organic compounds have been found even in interstellar clouds.
But the next step is huge. Life is characterised by two fundamental properties, replication and metabolism.
We know that this step has been made at least once, on Earth.
Even on Earth there is no evidence that this step has been made more than once! Click here for more information about what is called abiogenesis.
So, this is my position:
As soon as evidence of life will be found, on Mars or deep under the frozen oceans of Jupiter’s moon Europa , I will celebrate and be convinced that life indeed is teeming in the Universe.
Until then, I believe in the Rare Earth Hypothesis , that we might well be alone.
On 26 April 1920, a debate took place at the Smithsonian Museum of Natural History (Washington DC), between two American astronomers, Shapley and Curtis, about the scale of the Universe. Point of contention was the distance of the “nebulae” like Andromeda.
Shapley argued that the Milky Way was the entirety of the Universe and the Andromeda nebula was inside the Milky Way.
Curtis contended that Andromeda and other nebulae were separate island galaxies.
The debate became known later as The Great Debate.
We know now that Curtis was right. The Universe is huge and our Milky Way is only one of ~ 100 billion galaxies. Each galaxy contains on average 100 billion stars.
Our Sun is one of these ~ 10.000.000.000.000.000.000.000 (!) stars, and was formed relatively recently, about 4.6 billion years ago (The Universe is ~ 13.8 billion years old)
Eight planets orbit the Sun (sorry for Pluto, not a planet anymore…), and on (only?) one of them, our beautiful Earth, life developed, about 4 billion years ago.
Evolution took place. But it was only about 200.000(!) years ago that Homo Sapiens (yes, that’s us) evolved, most probably in Africa.
Was that a unique incident?
About half a year ago another astronomical debate took place, at Berkeley University, 30 April 2010, almost exactly 90 years later, and it was also called a Great Debate.
A bit preposterous, IMHO…:-)
This time the topic was: Are we alone in the Universe?
The recording of the debate can be viewed at http://seti.berkeley.edu/the-great-debate . Be warned, it takes 1.5 hours…:-), but watching it is worthwhile…
The SETI project is Searching for Extra Terrestrial Intelligence, so Werthimer is, not surprisingly, convinced that there are many planets with highly developed technological civilizations around us. SETI is searching for about 40 years now ‘only’, it will just take more time to find evidence for intelligent life elsewhere in the Universe, according to him.
Marcy is a skeptic. Ok, many, if not most, stars will have planets orbiting around them. And he agrees with Werthimer that primitive life will be “teeming” in the Universe.
But intelligent life? Is that an evolutionary advantage? The dinosaurs ruled the world for 200 million years and never developed intelligence with their peanut brains! Why not?
Maybe speed or a thick skull will serve you better to survive. Maybe we humans are just a freak evolutionary incident?
He has other interesting arguments. For example the water content of a planet. Quite critical.
Assuming that water has been brought to the earth by asteroids, it should be about 0.03%. Not more, nor less.
Less, and the planet will be a desert. More, and it will be just oceans. Is a technological civilisation possible under those adverse conditions?
At the end of the debate, after a Q&A session, there is a poll for the audience. Are we alone or not?
I have an opinion myself, but will only tell you in the second part of this email…:-)