The Toba eruption

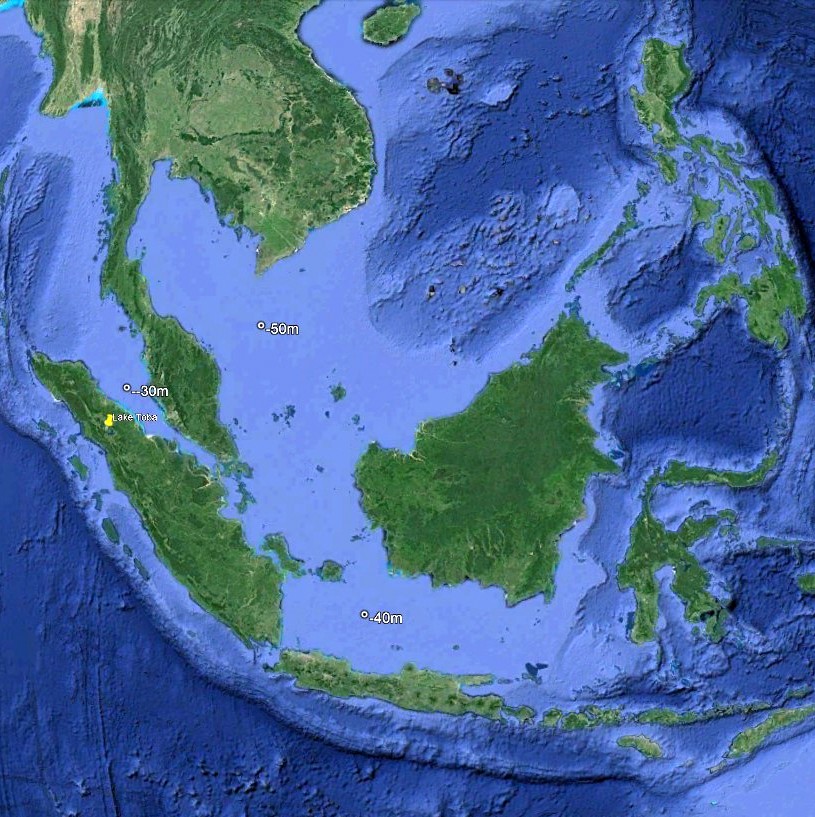
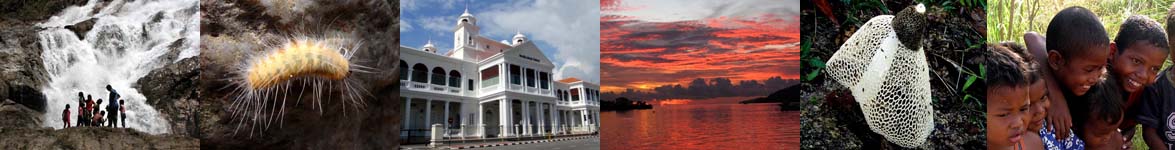
Here is a Google Earth image showing part of Sumatra with its capital Medan. The Malaysian coast is at the right with the harbour of Port Klang. Lake Toba, about 100 kilometres long, 30 kilometres wide, and up to 505 metres deep is the largest volcanic lake in the world. Volcanic? Yes, about 74.000 year ago, there was a volcanic eruption, the largest-known explosive eruption on Earth in the last million years. The eruption left a caldera, which is now lake Toba.

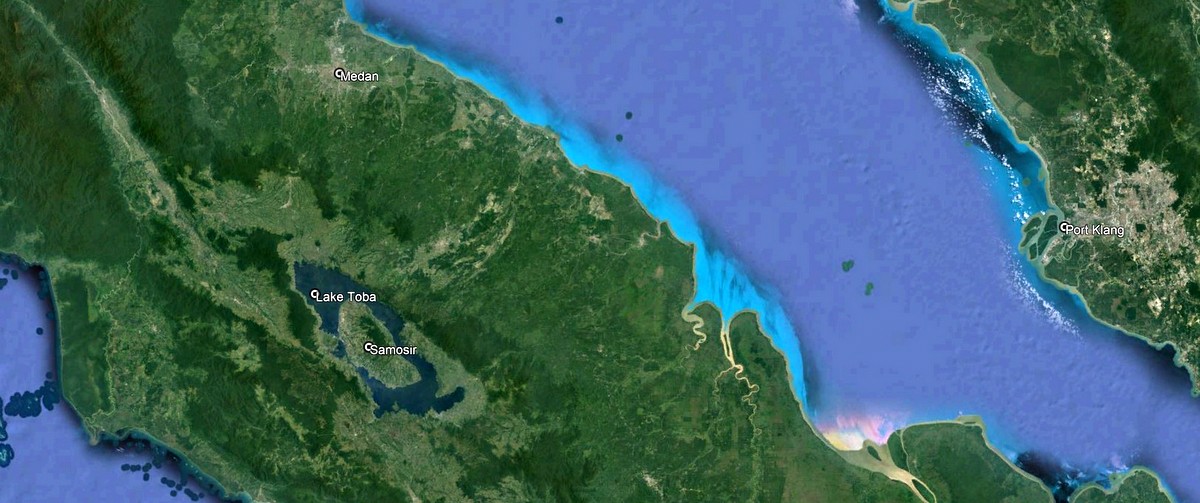
There exists a classification for explosive volcanic eruptions, similar to the Richter scale for earthquakes. It is called the Volcanic Explosivity Index (VEI). During an explosive volcanic eruption lots of (molten) rocks and ash (called tephra) are expelled into the air and it is the (estimated) volume of this tephra that is used to classify the eruption. Here is the VEI scale. Like the Richter scale it is logarithmic, each following step means a ten-fold increase in ejected volume. The “How often?” row gives an estimate of the frequency of the eruption, not surprisingly huge eruptions are very rare. There is an older classification of volcanic eruptions, Strombolian, Plinian etc, see Eruption Classifications. The last row gives an estimate of the plume height.

Here are a few examples

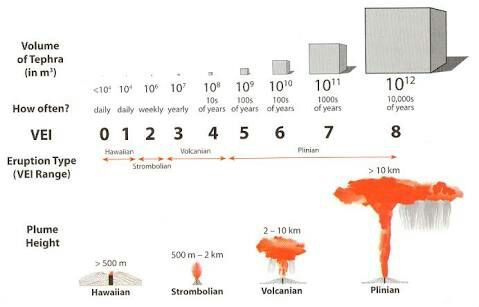
The Etna is Europe’s largest active volcano located in Sicily in southern Italy. On average it has a VEI index of 2. I visited this volcano twice, in July 1971 and July 1979. In 1971 it had erupted in April. Lava flows had caused a lot of damage and it was a special sensation to walk over solidified lava that was still hot under your feet. In 1979 it erupted in August but during my visit I still could climb up to the rim of the crater.

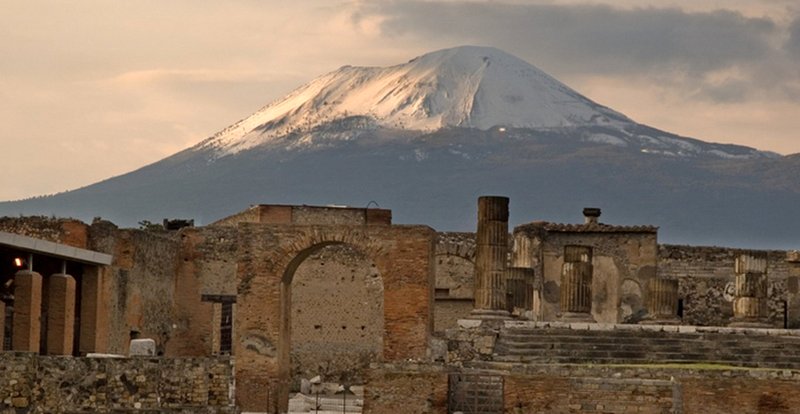
The Vesuvius volcano is also located in Italy, near Naples. It is not very active at the moment but erupted in 79 AD. spewing 3.25 km³ of tephra, destroying the cities of Pompeii and Herculaneum. VEI index 5. A catastrophic event.

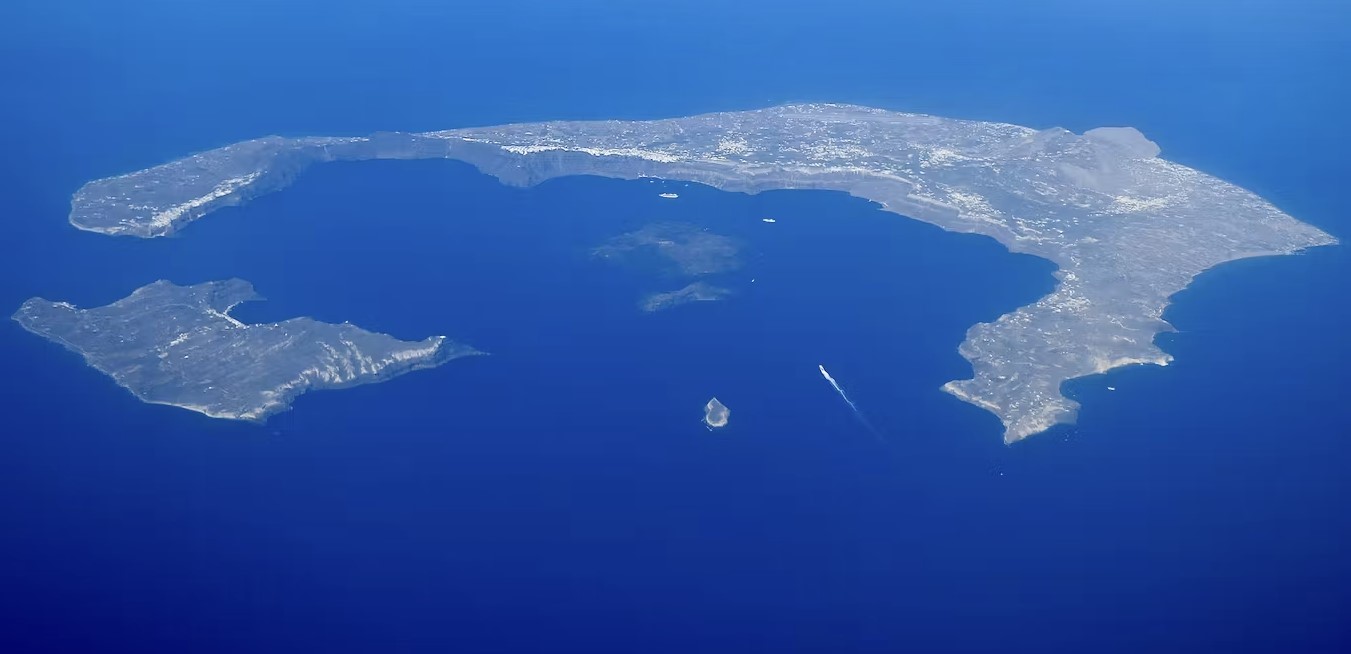
And that is only VEI-5. Here is the island Santorini in Greece, Or rather what is left of it after a volcano erupted on the island circa 1600 BCE . The eruption volume is an estimated 34.5 km³, so the VEI index is 6. In the center of the caldera two small volcanic islands have been formed. There is still a lot of discussion about the exact date of the eruption, it may have caused the downfall of the Minoan culture.

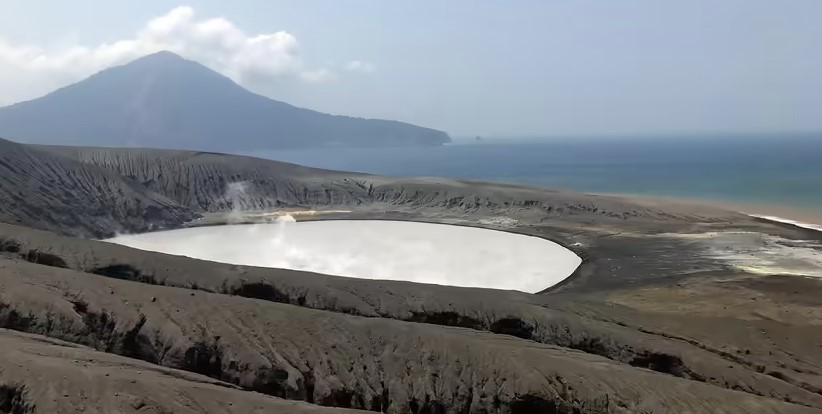
VEI-6 eruptions are not rare, they occur globally with a frequency of 50-100 years. In 1883 the Krakatoa erupted (8–25 km³ ) . Similar to Santorini, in the resulting caldera a volcanic island, Anak Krakatoa has formed. In this photo seen in the foreground, with Krakatoa in the background.

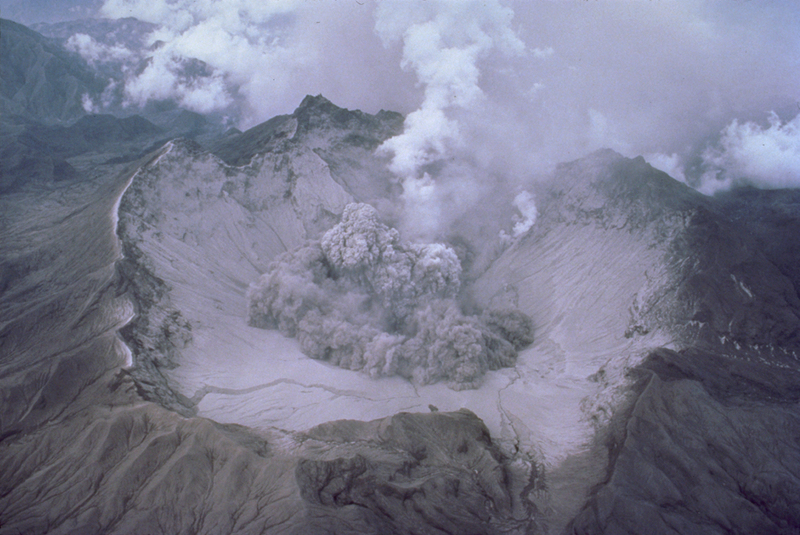
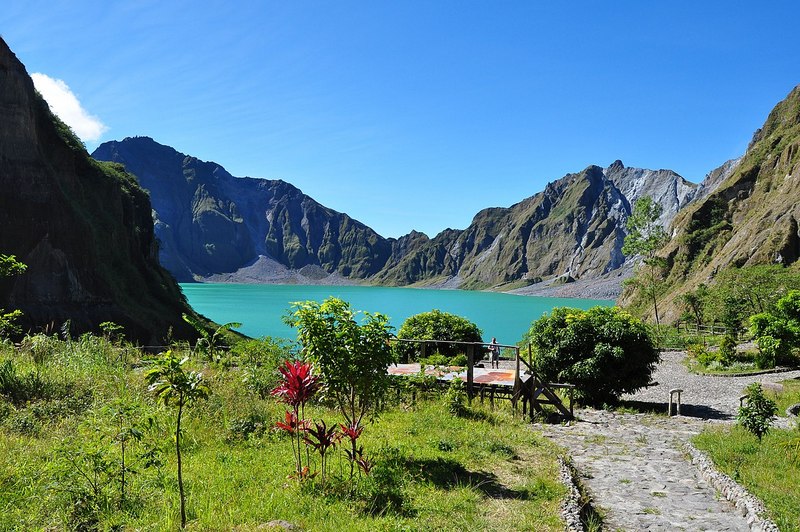
The most recent VEI-6 eruption was Mount Pinatubo in 1991 with an erupted volume of 12.5 km³ Two photos, one taken about one month after the eruption, the other one taken in 2012, where a lake has formed in the caldera. What a contrast 😉

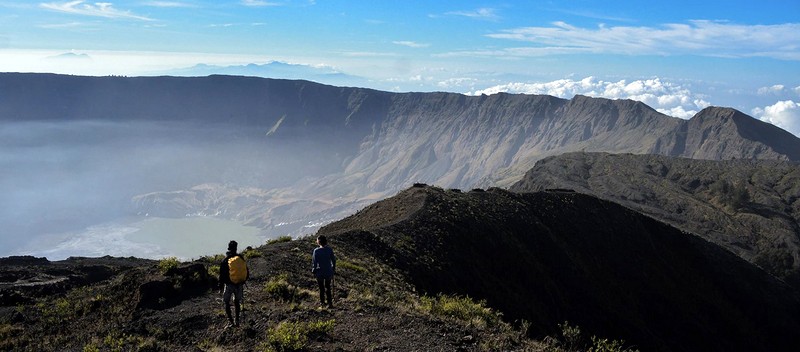
In recorded history there is only one VEI-7 eruption, Mount Tambora in 1815 with an eruption volume of 144–213 km³ Located on the Indonesian island of Sumbawa, it is now a tourist attraction. The caldera is 6-7 km wide and 600-700 meter deep.

VEI-7 eruptions are so powerful that the plume reaches the stratosphere. This can lead to a volcanic winter event. The lighter particles and ash fall/rain down, but the plume also contains massive amounts of gases like SO2 and H2S which in the stratosphere  react with OH and H2O to form H2SO4 (sulphuric acid) aerosols. They reflect the sunlight, remain in the stratosphere for months or even years and spread globally. The effect is a temporary climate change, affecting crops etc. The year 1816, one year after the Tambora eruption was a Year Without a Summer ! Average global temperature was 0.4–0.7 °C lower, causing major food shortages in many countries.

After this long introduction, it’s time to come back to the Toba eruption. Because it happened so long ago, the estimates of the ejected tephra are of course less accurate, they vary between 2000-13200 km³ A recent one gives 8600 km³. Meaning that the Toba eruption was at least a VEI-8 (more than 1000 km³) and possibly even a VEI-9 (more than 10.000 km³).

How much is 8600 km³? Well, if all that tephra would be deposited over Peninsular Malaysia, it would result in a layer of about 65 meter thick!

When you compare the Tambora eruption with the Toba eruption, Toba should have resulted in a much stronger volcanic winter, possibly lasting many years if not decades.

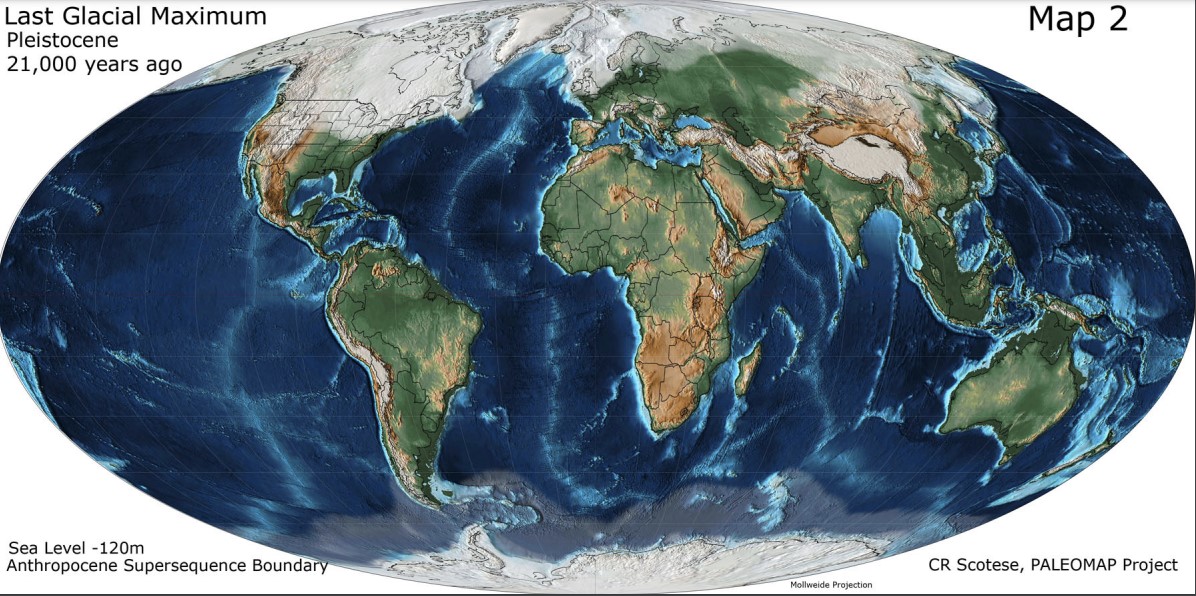
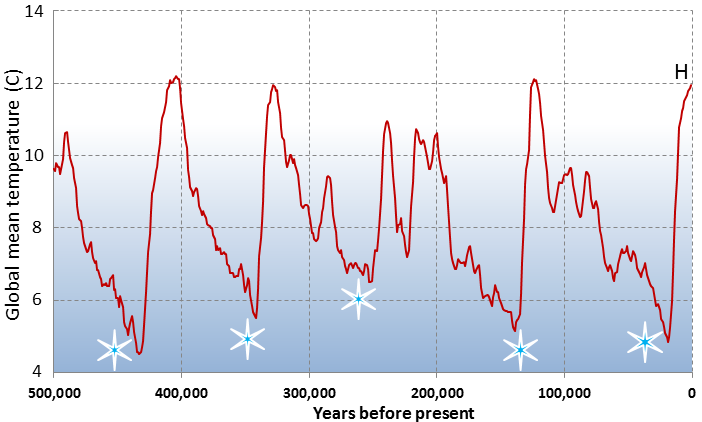
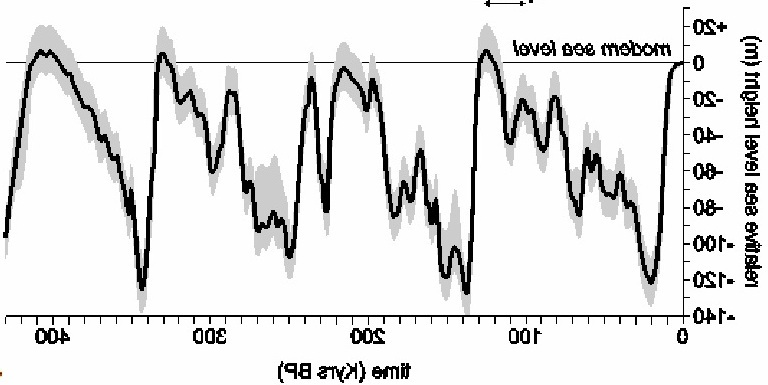
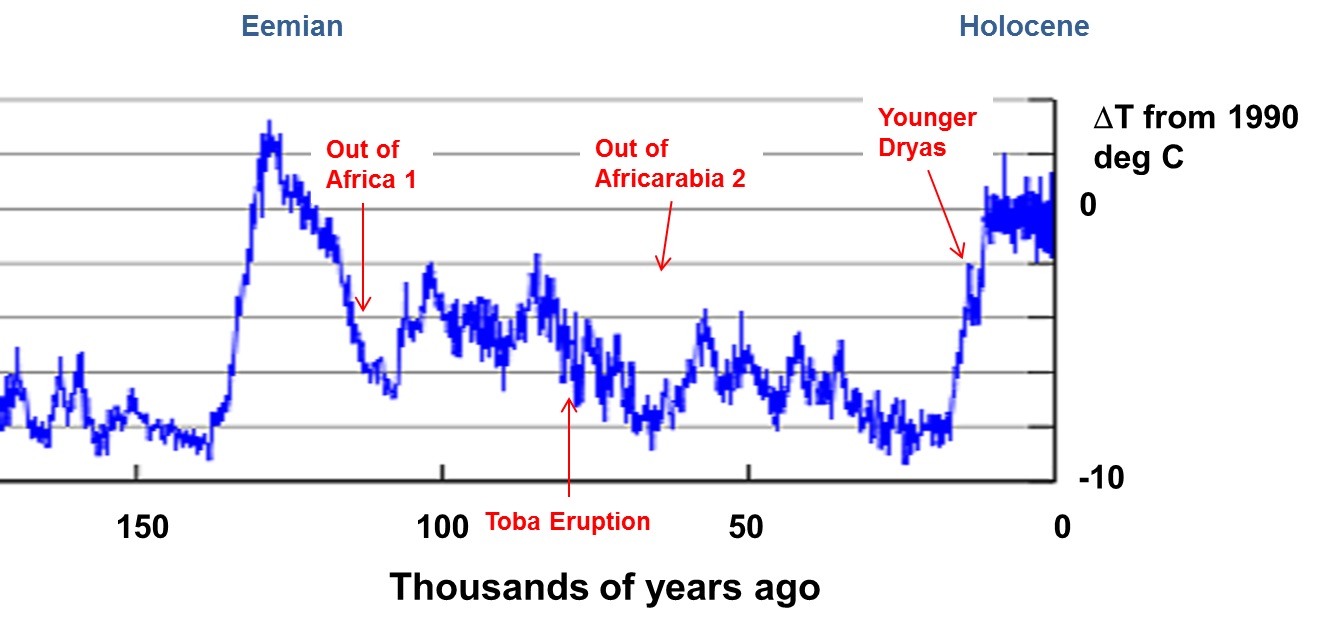
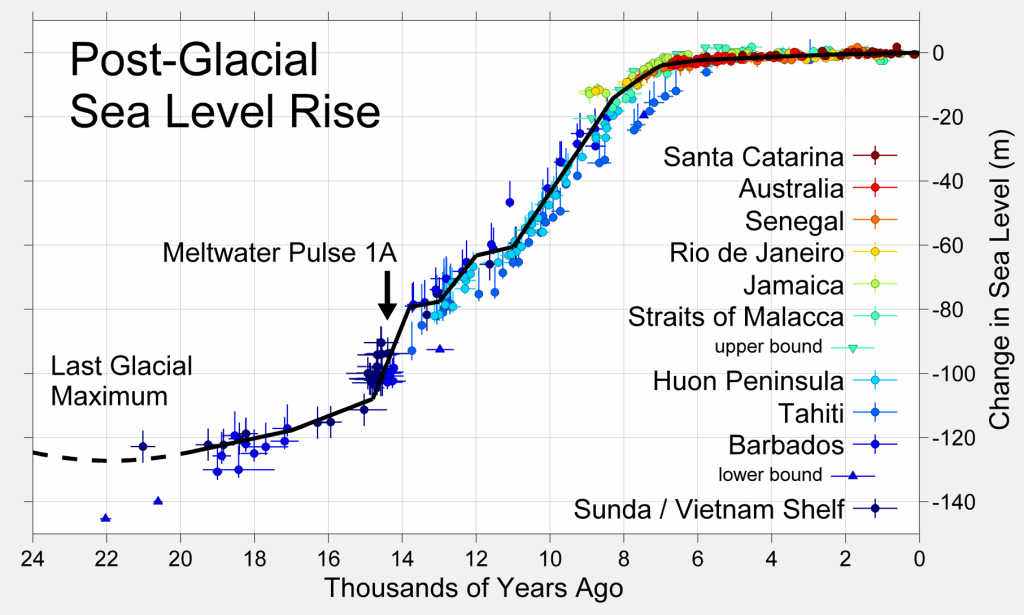
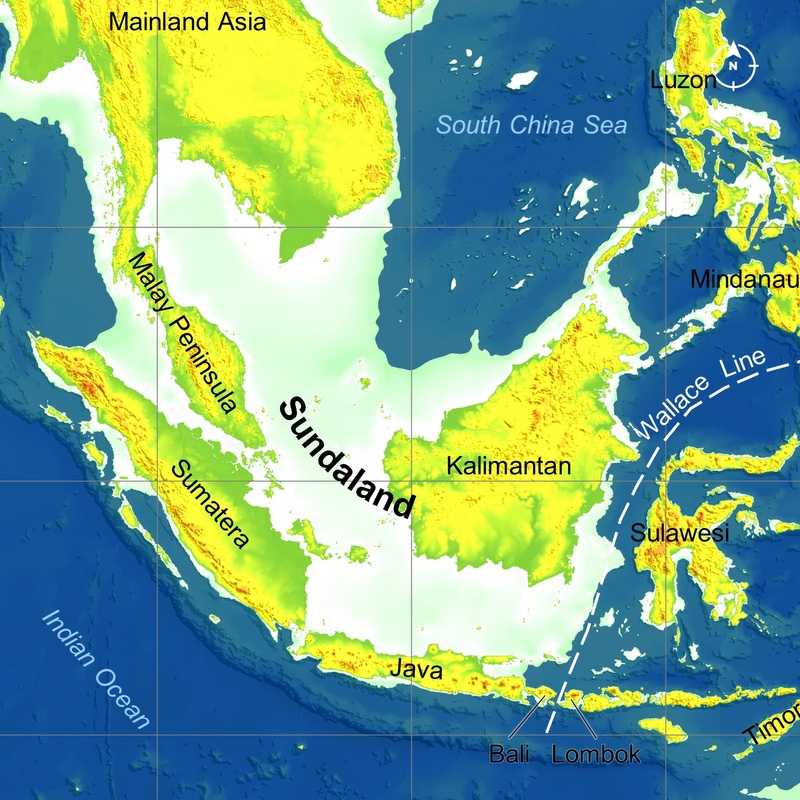
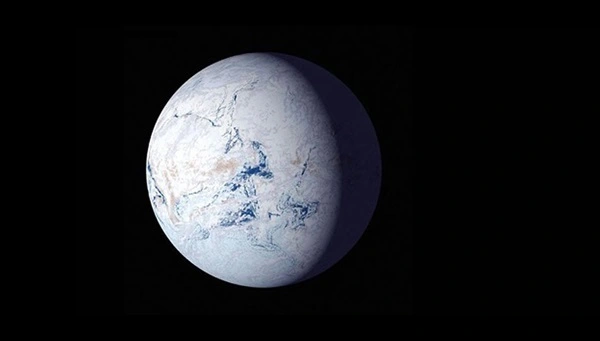
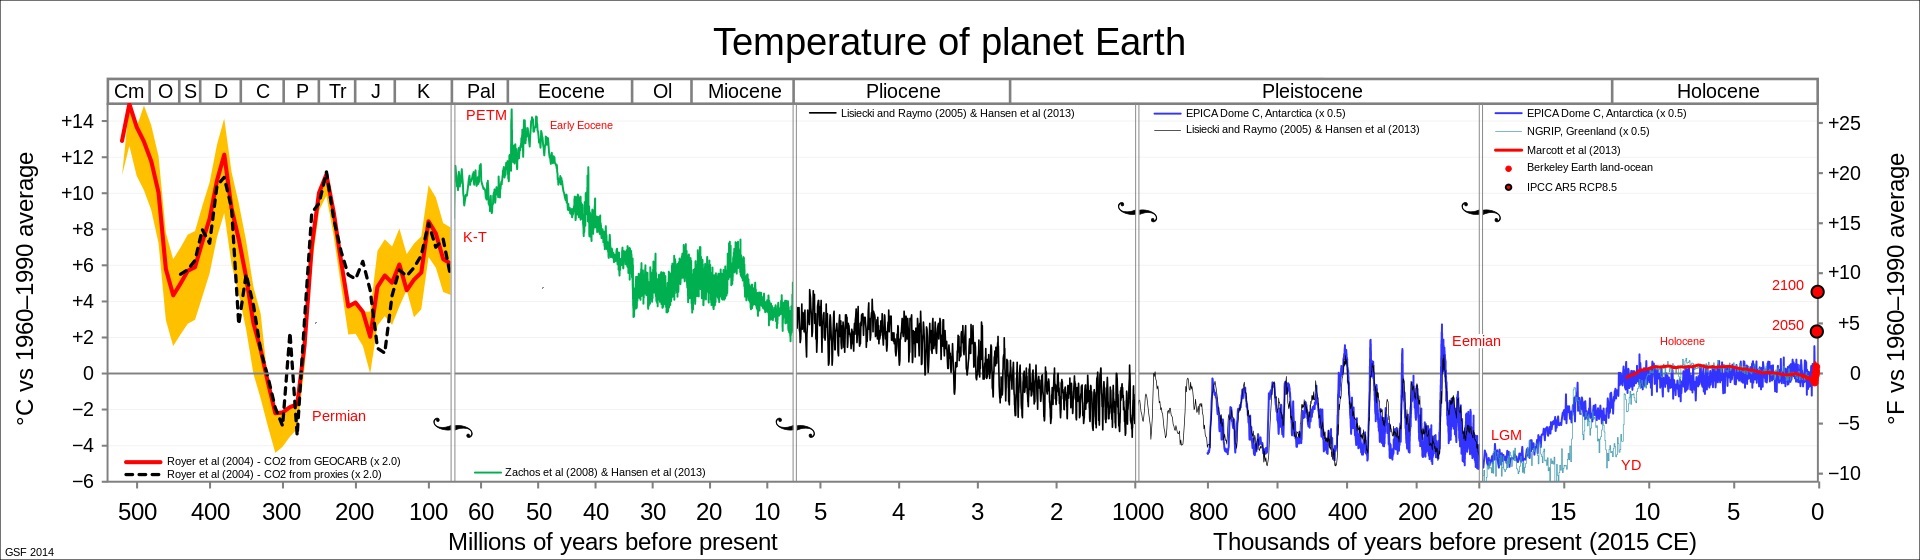
Could such a volcanic winter have affected our species, Homo Sapiens ? The Toba eruption happened during the Last Glacial Period . It was in that same period that waves of Homo Sapiens migrated out of Africa. This graph shows global temperatures during the last 150.000 years. The Eemian and the Holocene (our present era) are warmer Interglacials. During the Last Glacial Period temperature dropped as did the sea levels. See my blog posts Ice Ages and Sundaland. As you see in the graph, the temperature variations are rather irregular. There are markers for the Out of Africa waves and the Toba eruption

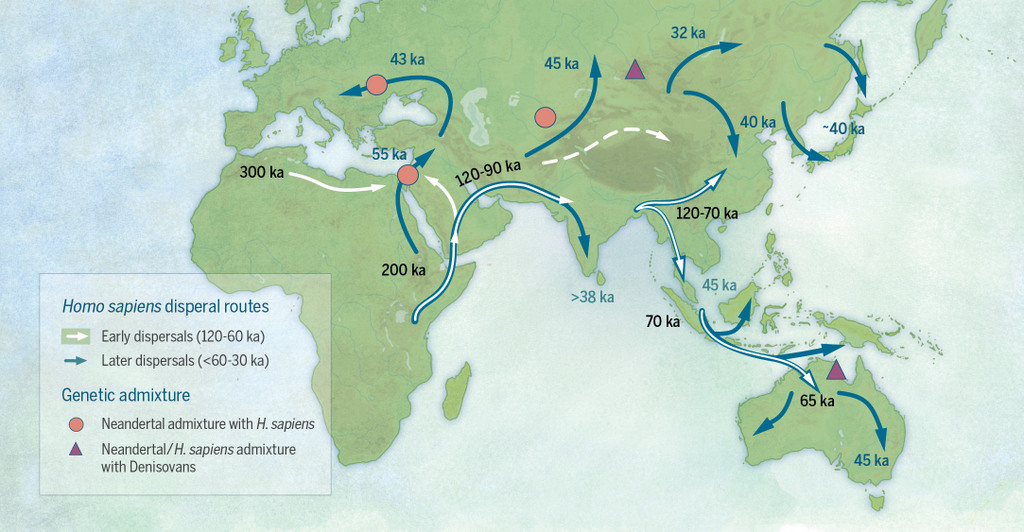
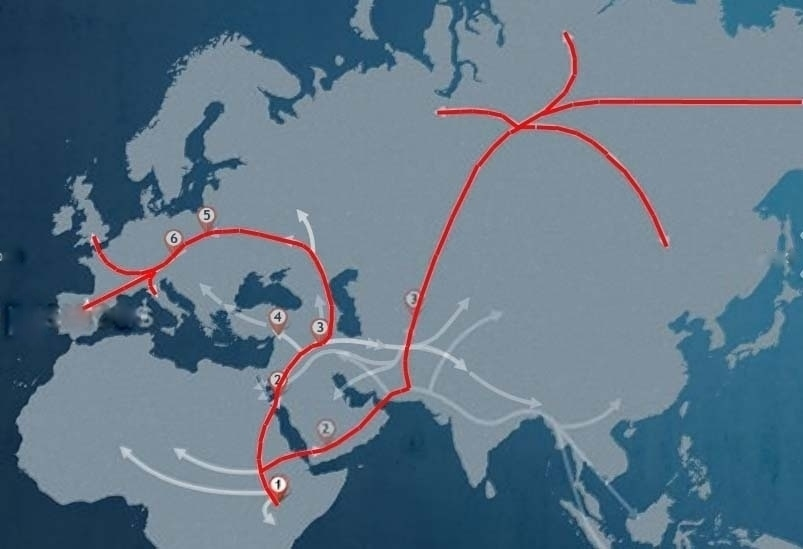
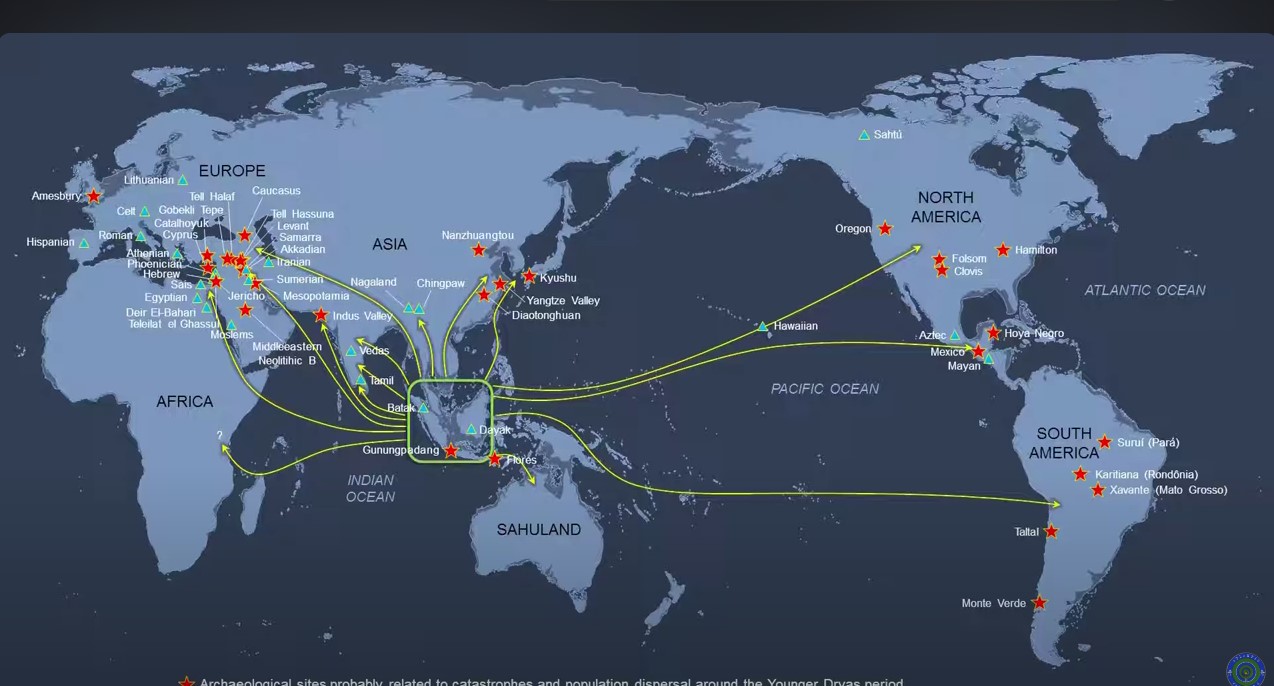
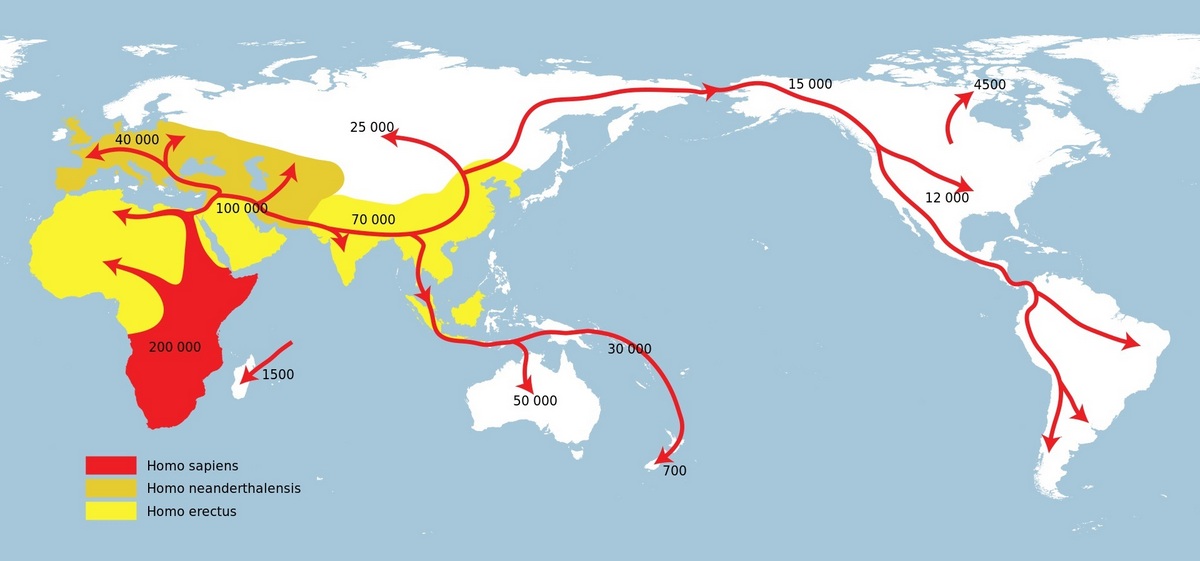
In this map the spreading of Homo Sapiens is shown (in red) together with the distribution of earlier human ancestors, the Neanderthals and the Homo Erectus. In 2012 I did a DNA-test to find out when my ancestors left Africa. For my paternal ancestor that was around 50.000 years ago, my maternal ancestor left earlier, ~70.000 years ago. Both after the Toba eruption. Here is my blog: My ancestors .

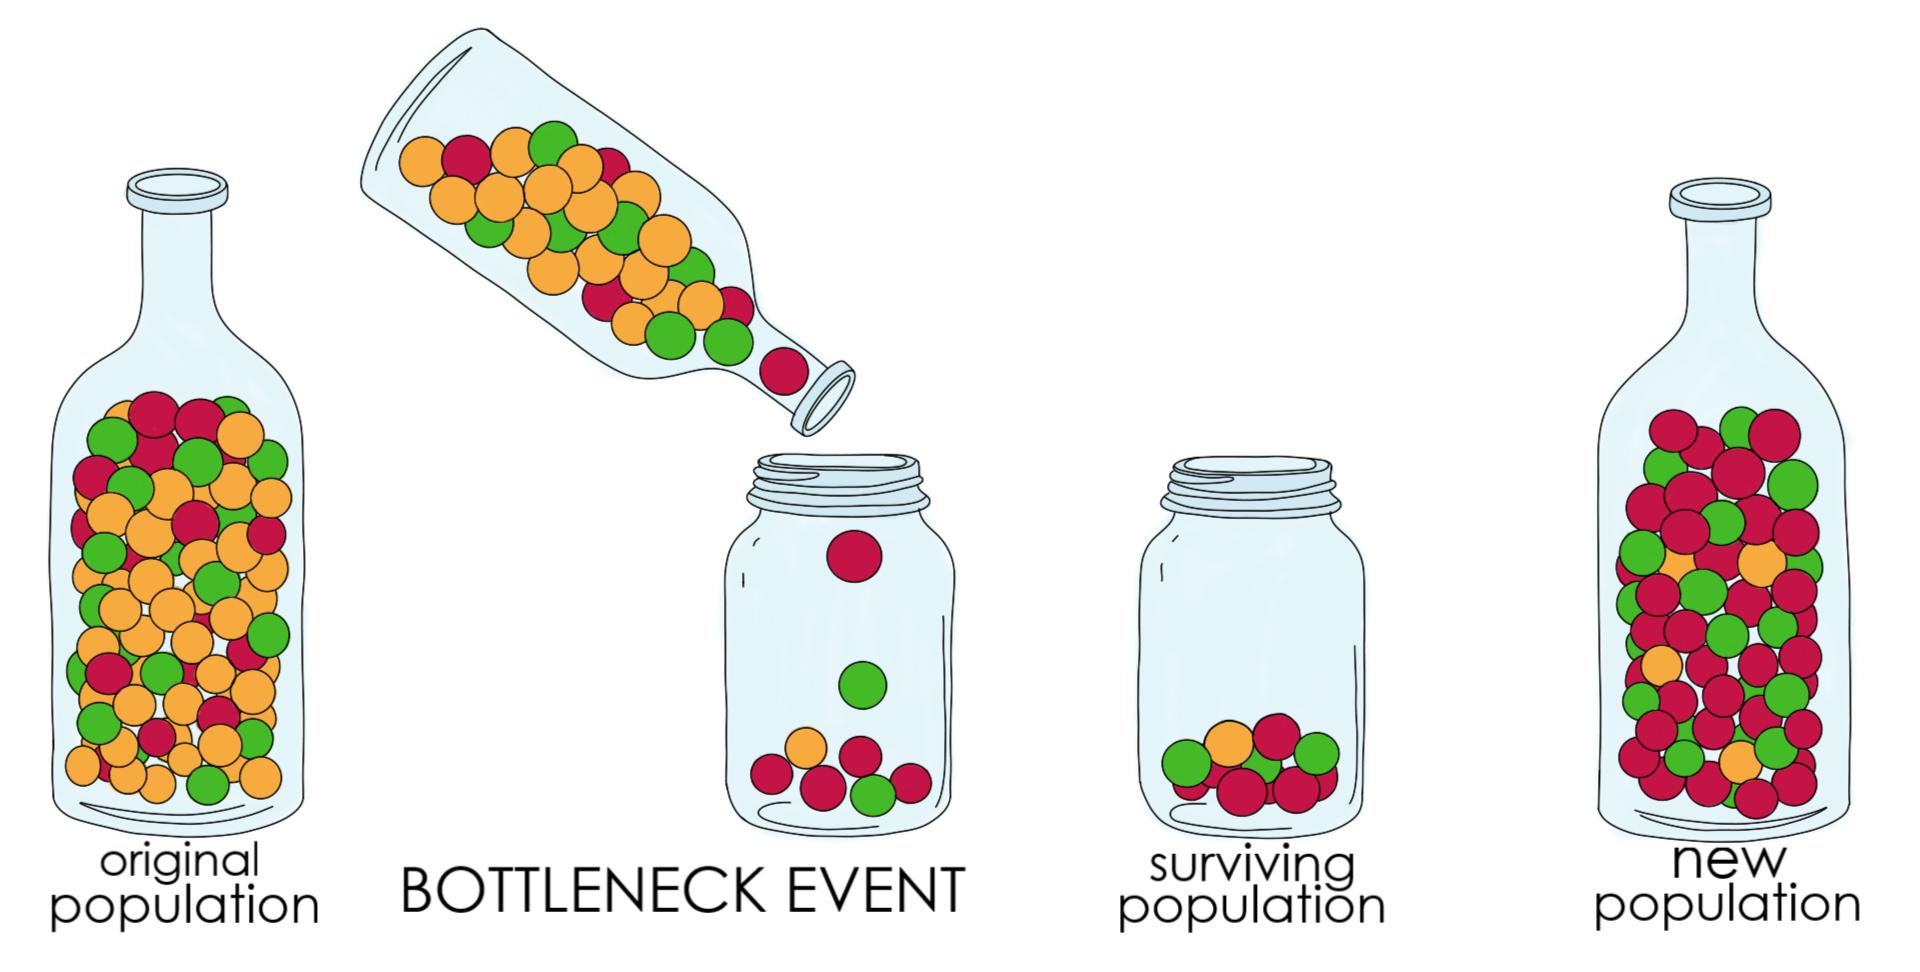
The Homo Sapiens population in Africa was small and the migrating groups even smaller, think about numbers in the thousands. They were hunter-gatherers. Sudden climate change might threaten their existence. The Toba Catastrophe Theory, developed a few decades ago, holds that the Toba eruption caused a global volcanic winter, leading to a near extinction of Homo Sapiens, causing what is called a (human) genetic bottleneck. Here is an illustration of a genetic bottleneck. Because only a small number of individuals survives the bottleneck, their genetic diversity is limited.

It is generally accepted that there have been many bottlenecks in the human evolution, Click here for an article about it. And a few months ago Scientific American published an article Human Ancestors Nearly Went Extinct 900,000 Years Ago That was the time of Homo Erectus, long before Homo Sapiens evolved.

The Toba Catastrophe is controversial. Did the Toba eruption produce a bottleneck? Was the Toba Volcanic winter so severe and long lasting that the global population of Homo Sapiens was reduced to about 1000 breeding pairs?

One vocal proponent of the Toba Catastrophe is Donald Prothero, an American geologist , paleontologist and prolific writer In 2018 he published When Humans Nearly Vanished about the Toba Catastrophe.

But here is an equally vocal opponent, John Hawks, an American paleoanthropologist with a popular blog, who wrote in the same year 2018: The so-called Toba bottleneck simply didn’t happen. He mentions research that humans thrived in South Africa during the Toba eruption.

I am not an expert, so don’t expect a verdict from me 😉

Nowadays Lake Toba and Samosir are tourist attractions of Sumatra. Here is a more detailed Google Earth image. Samosir was originally a peninsula until in 1907 a canal was opened through the isthmus.

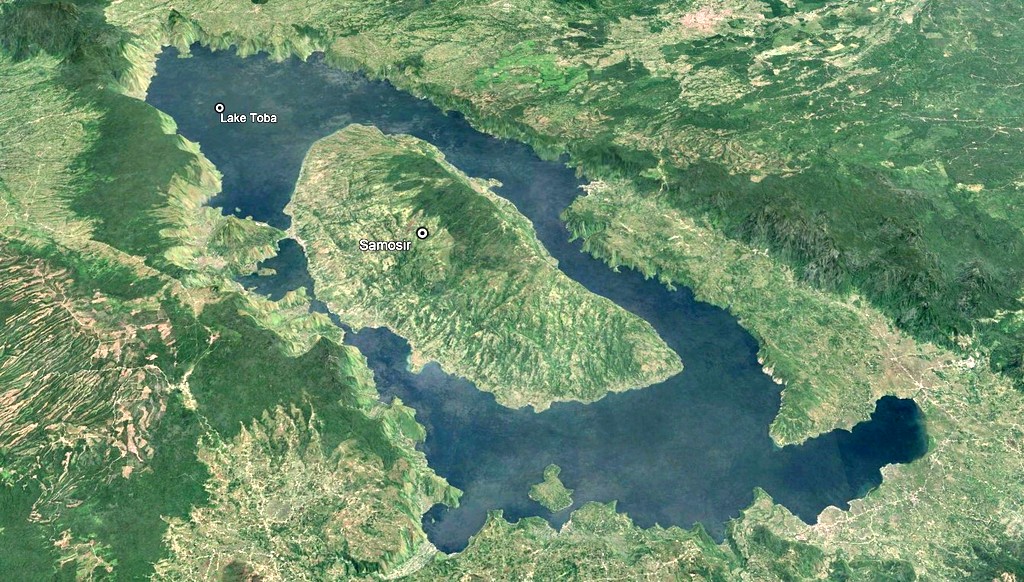
I have visited Samosir in 1994, thirty years ago, I don’t remember much about it. Peaceful, interesting Batak culture. You don’t realise that you are staying on top of a dormant volcano. Deep below Lake Toba is a huge magma chamber (50.000 km³ ) that is filling up slowly with magma. This has lifted Samosir already around 450 m. Will there be another supervolcano eruption? Yes, but no need to worry, that may take another 600.000 years.

Sundaland

One year ago I wrote a post about the Paleomap Project. At the end of that post I included a link to the Story of the Malay Peninsula. Here it is again. The clip is less than 3 minutes and worth watching.

I ended my post with: Notice how during the Ice Ages the sea-level was so low that the islands of the Malay archipelago were connected. This was called Sundaland. Topic for another post.

Here is my post about Sundaland.

What is actually an Ice Age?

Probably most people will first think about the funny Ice Age movies, but hopefully many will also know that there has actually been a period in Earth’s history, where the climate was cold and a large part of the Earth (North America, Europe) was covered with ice. That was about 21 thousand years ago and it is commonly called the Ice Age. Here is a Paleomap of Earth during that time.

Notice that the map doesn’t say Ice Age, but Last Glacial Maximum ! I got interested, Googled a lot and wrote a separate post Ice Ages. Here is a summary.

  • In the 4.5 billion years of its existence, Earth has been mostly (~85%) a Greenhouse, no icecaps, icesheets, glaciers. But there have also been at least five major periods that Earth was an Icehouse, partially covered with ice. These Icehouse periods are called Ice Ages. At this time Earth is in the Late Cenozoic Ice Age, which started 34 million years ago.
  • In an Ice Age there is always permanent ice, but the amount fluctuates. There are periods that the ice advances, they are called glacials. And there are periods that the ice retracts, called interglacials.
  • The last glacial was about 21.000 years ago and is often called the (Last) Ice Age. At the moment we are living in an interglacial, icecaps, icesheets, glaciers are retracting. But Earth is still an Icehouse.

There have been numerous glacials and interglacials in those 34 million years. Here the global temperatures for the latest are shown. Notice that the timescale is from right to left, so the last glacial (“the Ice Age”) is the rightmost snowflake. And there is an obvious regularity with a period of roughly 100.000 year. If you want to know more about the theory, read the Milankovitch Cycles article in Wikipedia.

In this blog we are especially interested in sea levels. During a glacial a lot of water is frozen in icecaps, icesheets and glaciers, so the sea level drops, and during an interglacial ice melts and the sea level rises. Here are the sea levels during the last 400.000 years. In the original graph time goes from left to right, I have flipped it to make comparison with the temperature graph easier. Notice the similarity between temperature and sea level. During interglacials sea levels were about the same as nowadays, but during glacials they were up to 120 meter lower.

I will now concentrate on the last 150 thousand years, Here is a more detailed temperature graph. Starting from the left, we see the end of the Penultimate Glacial at about 135 thousand year ago. It was a very cold one. Then, relatively quite fast, temperatures are rising, until they reach a maximum at 125 thousands year ago in the Eemian Interglacial. Warmer than nowadays, sea level 6-9 meter higher (!) than today. After this maximum, slowly and irregularly , temperatures are dropping, until a new glacial maximum is reached, about 21 thousand years ago. After this the temperature rises again and we reach the Holocene interglacial in which we are living nowadays.

This time period is very interesting for homo sapiens. Indicated are two waves of migration out of Africa. And about 74.000 year ago the Toba volcano on Sumatra erupted, one of the largest eruptions in Earth’s history. Present day Lake Toba is occupying the caldera of this eruption. There is a theory that this eruption almost caused the extinction of homo sapiens, but this Toba catastrophe theory is something for a separate blog.

We zoom in one more time and look at the sea level. It was 120 m below present during the last glacial maximum, then rising more or less gradually until it reached present levels around 6000 years ago. Around 12-14 thousand years ago, there was an interruption with a cold period (Younger Dryas). Also notice the steep increase around 14 thousand years ago, caused my melting icesheets , about 5 cm per year !

A sea level rise of 120 meter is enormous. Here is a Google Earth screenshot of South East Asia. The color of the sea indicates how deep it is, light blue is shallow, dark blue deep. When you open Google Earth on your computer and move your cursor over the screen, the depth is indicated. I have done that for three locations, and found 50, 30 and 40 meter.

When the sea level drops 120 m, the whole light blue region would become land!

Here is how the region would look like, 21 thousand year ago. Sundaland! A continental shelf, exposed when the sea level is low. If there had been public transport in those days, you could have traveled overland between Indonesia, Malaysia, Thailand, Cambodia en Vietnam! And in the far future, during the next glacial, that will be possible again 😉 .

Here is a video, where you can follow Sundaland from the last Ice Age until present. Only 44 seconds, worth watching. Created by Dhani Irwanto, more about him later.

There are more regions on Earth where something similar has happened. In the lower right part of the video, you can see part of the Sahul shelf. During the last Ice Age Australia and New Guinea were connected.

And in Europe during the last Ice Age, England, Ireland and mainland Europe were connected. The continental shelf is called Doggerland. Around 6500 year ago England became an island (again).

One more example. During the last Ice Age Tamil Nadu and Sri Lanka were connected. In this Google Earth image I have roughly marked the contour line (isobath) of 120 m below sea level. Some land is now submerged but not a continent as some Tamil nationalists still believe. See my blog Kumari Kandam & Lemuria.

Sundaland is a huge landmass (~ 1.8 million km2), now partially submerged. but large during the time that homo sapiens migrated out of Africa. Here are some of these Early Human Migration routes.

1in 2012 Aric and I took part in the Genographic Project , we sent samples of our DNA and got it analysed. It resulted in this map with the routes followed by our (maternal) ancestors. Read my blog My Ancestors for more details.

As you see there are migration routes to South East Asia and Sundaland. Could it be that during this last glacial there was a civilisation in Sundaland, later destroyed by the rising sea levels? Could that have been the lost continent, Plato’s Atlantis? Or the Garden of Eden?

In the last few decades, three books have been published advocating exactly that. In 1999 Stephen Oppenheimer published Eden in the East. According to him it was Sundaland where the first human civilisation started. After Sundaland became flooded (Noah’s flood!), the population dispersed and fertilized the cultures of Mesopotamia, Egypt, China and India. A few years later, in 2005, Arysio Santos published Atlantis, the lost continent finally found. Santos was convinced that Sundaland was the Garden of Eden and Plato’s Atlantis. Quite recently, in 2019, Dhani Irwanto published Sundaland: Tracing The Cradle of Civilizations. Same approach. All these books are still for sale at Amazon.

It’s a fascinating topic, and there is no doubt that Sundaland existed. But Atlantis, the Garden of Eden, the Cradle of Civilisation? Here is some information about the authors.

  • Stephen Oppenheimer (1947-) is a British paediatrician and geneticist. After 1997 he started a new career as a researcher and popular-science writer on human prehistory.
  • Arysio Santos (1937-2005) was a Brazilian nuclear engineer, but “his true hobby in life was researching arcane subjects such as Symbolism, Alchemy, the Holy Grail, Comparative Mythology and Religion” (quote from his own website)
  • Dhani Irwanto (1962 -) is an Indonesian hydro civil engineer. Founder of Indonesia Hydro Consult in 2010 and its director until now. Became interested in Sundaland and has written books about it.

The authors have in common they have no formal training in the subject matter. They were captivated by the subject and delved into all aspects of it, climatology, geology, linguistics, anthropology etc. Their approach, especially Irwanto’s, tries to be scientific. But it is still Fringe Science, outside the mainstream discipline.

I was considering to buy Irwanto’s book, but then I discovered a video Tracing the Cradle of Civilisations in Sundaland, about a lecture he gave in the Philippines in 2017 at an Asean Advanced Archaeology Symposium. Brilliant presentation, worth watching (28 minutes).

But he is really going too far in his enthusiasm. Here is a screenshot from the video. Everything, all over the world , originated in Sundaland. So I may not buy the book.

Ice Ages

What is an Ice Age? And how many Ice Ages have there been on Earth? I came across these questions, while writing a blog post about Sundaland. During the Ice Ages the sea level was much (~ 120 meter) lower than at present and the islands of the Malay archipelago were connected to Thailand, Cambodia and Vietnam. This landmass was called Sundaland. In my blog Sundaland (still under construction) I write in more detail about it.

If what follows is too detailed for you, just jump to the summary

During the 4.5 billion years that Earth existed, Its climate has fluctuated between Greenhouse and Icehouse. During a Greenhouse there were no glaciers, no icecaps (South Pole), no Ice sheets (Greenland) no permanent sea ice (North Pole). Earth was mostly a greenhouse , about 85 % of the time. Temperature was (a lot) higher than at present. Sea levels higher, sometimes 300-400 meter. Lots of carbon dioxide in the atmosphere. Tropical rain forests on the South Pole 😉

But there also have been Icehouses, often called Ice Ages, where glaciers, icecaps and ice sheets were permanently present. Scientists have identified 5 of them. Here they are marked on the 4.5 billion year timescale that Earth existed.

The Hadean, Archean and Proterozoic are the first three “aeons” of Earth’s geological history. We are now living in the last aeon , the Phanerozoic, which started ~ 542 million years ago, the name is too long to be named in the image. Before I “zoom in” on this last aeon, a few comments, related to blogs I wrote in the past.

  • Only a few million years after the formation of Earth, in the Hadean, our Moon was “born” as a result of a collision of Earth with another planet. Where does the Moon come from? .
  • The oldest fossils date back to the Archaean, 3.4 billion years ago, when Earth was still young. Therefore many think that life comes easily and must be ubiquitous in the universe. I am sceptical, see my blog The Drake Equation.
  • It took a long time before those simple cells evolved and developed a nucleus that contained the DNA, about 2,2 billion year ago in the Proterozoic. And it took even longer for multicellular organisms to develop, about 600 million year ago, at the end of the Proterozoic. See my blog The Tree of Life.

The Proterozoic had two Ice Ages. The Huronian actually consists of several separate Ice Ages and lasted about 300 million years The Cryogenian also has two separate Ice Ages, together lasting about 85 million years. The Cryogenian was severe, there may have been periods that Earth was completely covered with ice, a so-called Snowball Earth.

.Keep in mind that Earth looked very different in those days because of plate tectonics and continental drift. See my blog The Paleomap Project. Here is one of Scotese’s maps: Earth during the Cryogenian Ice Age.

Now let’s zoom in on the Phanerozoic, from 542 million year ago until present. The ‘official’ start of this aeon is 538.8 million year ago. This beginning was chosen because around that time a sudden , explosive diversication of life forms started, the Cambrian explosion. Multicellular organisms evolved into a multitude of species. Here is an artist impression.

The Phanerozoic had three major Ice Ages, the Andean-Saharan, 440 million years ago, lasting 40 million years, the Karoo , 300 million years ago, lasting 100 million years and the current one, the Late Cenozoic Ice Age , which started 34 million years ago and is still ongoing.

Here is a (complicated) graph of the global temperature during the Phanerozoic. Complicated because the timeline has been split in five parts, zooming in.

The first part (in red) covers from 542 Million years (Ma) until 66 Ma. The temperature data are less reliable, but you can see the Andean-Saharan (440), the Karoo (300) and an unnamed one (~180). Next comes the green part, timeline enlarged about 10 times, from 66 Ma until ~ 5 Ma. Around 66 million years ago a huge asteroid collided with Earth, causing the extinction of the dinosaurs and giving mammals the opportunity to develop. Earth was a hothouse then with a maximum temperature around 55 million years ago (PETM). After that maximum, global temperature started to decrease. Around 34 million years ago, Antarctica got an icecap and Earth became officially an Icehouse, the Antarctic Glaciation . The next zoom in (again x10, in black) shows how the cooling of Earth continued. Around circa 2.58 million years ago the Pleistocene started, ice “everywhere”, also in the Arctic region.

The next part, in blue, shows in more detail the last one million years of Earth. It’s clearly an Icehouse but there are periods which are colder (glacials) alternating with warmer ones (interglacials). If you would be able to watch Earth during this one million years, you would see the icecaps and ice sheets advancing during glacials and retreating during interglacials. The last of these “warmer” interglacials was the Eemian (130-115 thousand year ago. Followed by the last glacial (26-20 thousand years ago). It is this last glacial that is often, called the Ice Age.

At present Earth is in an interglacial, as can be seen in the last part of the graph (also in blue). This interglacial started around 12 thousand years ago and is predicted to continue for many thousands of years. These predictions are based on the theory of Milankovitch cycles, a bit to complicated to explain here. It may last 50 thousand years, or even longer because of human interference (climate change!). After the interglacial, a new glacial will start, because Earth is still an Ice House.

Summary:

  • Earth is an Ice House already for 34 million years. An Ice House (also known as Ice Age) consists of many glacial (colder) and interglacial (warmer) periods, each lasting thousands of years.
  • The last glacial period occurred 26-20 thousand years ago and is often called the ICE AGE.
  • At the moment Earth is in an interglacial and that will last for many thousands of years, possibly even longer because of human interference.

Of course there is a lot of information available these days about future climate developments. Not always reliable !

Here is a very dishonest one, A New ICE AGE Is Coming: Prepare To Freeze By 2050! A lot of factually correct information, leading to a ridiculous ending. Click on the link to watch the video, AYOR!. His advice: Pump more greenhouse gases into the atmosphere to avoid the impending next Ice Age (~ 2050!).

Here is a much more interesting one, New Evidence We Are Entering An Ice Age Termination Event Glacials have been ended numerous times by termination events. We are in an interglacial now, but it looks different this time. Could this be the start of a Hot House. We just don’t know.

The Paleomap Project

INTRODUCTION

Twenty years ago I started my own website. Although now in hibernation, this Stuif Site is still online. It has a Science -> Earth category, here is a screenshot of that page. I was quite interested in plate tectonics and continental drift and was planning to write more webpages about it. This never happened, the Earth page remained a “stub”.

But finally I have now decided to write a blog.

Recently I came across an article The Lost Continent of Kumari Kandam in which I found this map: I had never heard about Kumari Kandam and had to check Wikipedia: Kumari Kandam, “a mythical continent, believed to be lost with an ancient Tamil civilization

Apparently some Tamil revivalists still think that this continent really existed and actually was the cradle of civilisation, not Mesopotamia . The continent was submerged after the last Ice Age, when sea levels rose, forcing the Tamil people to migrate to other parts of the world. And yes, the sea levels rose after the last Ice Age, more than 120 meters. But have a look at the Google Earth nap of the Indian Ocean, where I have outlined Kumari Kandam. Mean sea depth is ~ 4 km!

So the Kumari Kandam continent never existed. A few months ago I have written a separate blog about this myth: Kumari Kandam & Lemuria .In that post I announced a post about continental drift and plate tectonics. Here it is.

THE STRUCTURE OF EARTH

When Earth was formed, 4.55 billion year ago, it was in a completely molten state. The heavier elements sank to the center, the lighter elements rose to the surface. Because of cooling soon a crust developed. Here are two images of present Earth , showing its structure. Basically there are three main layers, the Crust, the Mantle and the Core.

The Core consists mainly of iron and nickel. In the Outer Core they are liquid (high temperature) and are the source of Earth’s magnetic field. The Inner Core is solid, the temperature is even higher, (about 6000 °C) but the pressure is gigantic.

The mantle is basically solid, but the upper mantle is already so hot, that it behaves as a fluid on a timescale of many millions of years. This upper part is called the Asthenosphere. .

The right image gives more details about the size of the various layers. The crust of Earth is very thin, especially under the oceans (~6-7 km). The continental crust is much thicker , 30-70 km and less dense than the oceanic crust. Compare the Earth crust with the shell of a chicken egg, or the skin of an apple

The crust of Earth is not one whole, it is broken in many separate parts, called tectonic plates. Below you see the main tectonic plates at present. They “float” on the mantle, very slowly, about a few cm/year. Red arrows indicate the direction in which they move.

A few comments on this map

  • In the Atlantic Ocean the Eurasian plate and the North America plate move in opposite directions, creating a gap, that is filled by magma from the underlying mantle. They are called Mid-ocean ridges.
  • The Eurasian plate and the Indian plate collide, resulting in the Himalayas.
  • The Australian plate and the Pacific plate also collide, but here they create a Subduction zone. Because oceanic crust is denser than continental crust. the oceanic crust will go down under the continental crust and merge again with the mantel.

Two images as an illustration: a mid-ocean ridge (left) and a subduction zone (right)

These examples show that plates can change in time, they can also merge or split. In the past Earth has looked different, and in the future it will also look different.

THE PALEOMAP PROJECT

A paleomap is a map of Earth in the past, using information about tectonic plates. The American geologist Christopher Scotese started the Paleomap Project in the 1990s and is still actively working on it. Here are a few of his maps

This is a map of Earth, about 200 million year ago. In that period most of of the landmasses were connected and formed a supercontinent, named Pangaea. In the lower part, called Gondwana, you can already see the shapes of present-day Africa, South-America, Antarctica and Australia

Millions of years later, Pangaea has broken apart. Dinosaurs are roaming the earth

Earth starts to look a bit more familiar South-America and Africa have split, with the southern Atlantic Ocean separating them. Eurasia begins to take shape. Australia is still connected to Antarctica. Note that India has split from Africa.

Earth 66 million year ago. The impact of the Chicxulub meteor in Mexico causes the extinction of the dinosaurs and the rise of mammals. India is on a collision course with Asia and Australia has split from Antarctica.

Present Earth..

More maps can be found here. The oldest map shows Earth 513 million years ago

These are static images, it would be nice to follow the development in time through animations The Paleomap Project homepage has many animations , but they do not work anymore, because they are using Java applets, which most browsers don’t accept nowadays. The site has not been updated since 2003 and I assumed that the project had been stopped. But searching information for this blog, I discovered that I was wrong, Scotese is still very active! But nowadays he and his coworkers create YouTube videos. Here is one of them. Time runs backwards, the video starts with the modern Earth and goes back to 750 million year ago.

It is also possible to predict how Earth will look like in the future. Of course such a prediction is less accurate because you have to extrapolate , using current plate movements.. Scotese’s prediction is that in the future another supercontinent will form, which he has called Pangaea Proxima. Here is the video. Notice that Australia will merge with Asia and l Antarctica.with India. The Mediterranean Sea will disappear.

Scotese’s YouTube Video Channel contains more than 70 videos about aspects of plate tectonics and continental drift. I will mention one more here, about the Story of the Malay Peninsula. (There doesn’t exist a Story of the Netherlands because God created the world, but the Dutch created The Netherlands 😉 )Notice how during the Ice Ages the sea-level was so low that the islands of the Malay archipelago were connected. This was called Sundaland. Topic for another post.

A few concluding remarks

  • Before Pangaea there have been several more supercontinents. Click here for a list.
  • When plate tectonics started on Earth, is still a matter of dispute. Possibly 3 billion year ago.
  • It can be argued that plate tectonics has been essential for the development of life. Watch this fascinating video The World before Plate Tectonics.