Rock Balancing

A few years ago I have started a habit of building a stone marker when I visited a waterfall. A sign that I had been there. Here is an example

Stone marker

And here is a collage of many more. It is a nice pastime and doesn’t require much effort. Just collect a few suitable rocks and see how tall you can make the tower. A downpour, or strong wind, and it will be gone. So I leave only a temporary marker, which I find quite symbolic for human existence in general..:-)

collage

It can also be done in a very different, spectacular way! Recently a friend sent me an email with pictures of amazing balancing rock formations. Like this one

Gravityglue1

The “maker” is a young Canadian artist/designer, Michael Grab. He has a website Gravity Glue where you can find many more of his creations.Here are a few

Balance-Art-By-Michael-Grab_09Balance-Art-By-Michael-Grab_05Gravityglue3Gravityglue2

I find them extremely, almost unearthly, beautiful. They seem to defy gravity, although as a physicist  I understand of course that it is gravity which keeps the pieces of rocks in place, at least temporarily.

Not surprisingly some of the comments on his website suggest that it is all fake, that he is using superglue, or metal pins to keep the parts together. Watch this short YouTube video (until the end!) for a convincing proof that it is NOT fake…:-)

You can find more YouTube videos on the Internet, for example this one. Although I do not share his philosophy, I admire his patience and perseverance.

Physics Nobel Prize (2011)

The Nobel Prize for Physics in 2011?

But that is long ago, the Nobel Prize 2012 has already been awarded and in October the winners of the 2013 prize will be known!

Yes, this post is long overdue, I know 🙂 Every year I am interested, being a physicist myself, who will get the Nobel Prize for physics and for what . And nowadays often I have no idea what it is about :-(, being out of touch with the modern developments for so long already. So I was quite happy that I understood the importance of the discovery made by Perlmutter, Schmidt and Riess in 1998 that our Universe is expanding at an accelerated rate.

From left to right, Perlmutter, Schmidt and Riess

2011_nobel_prize

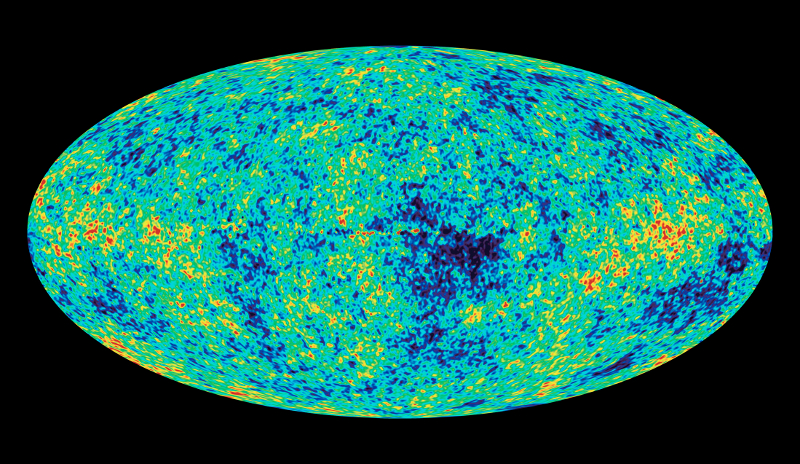
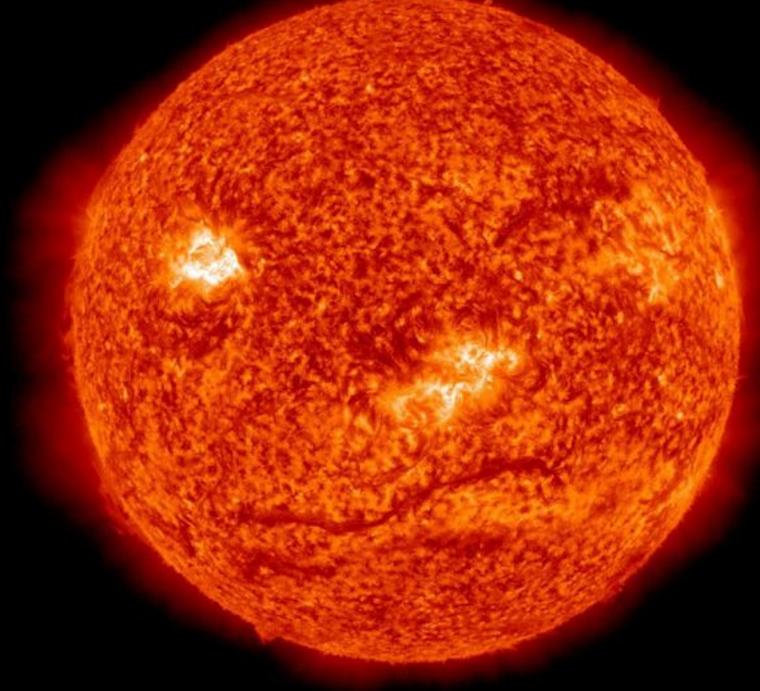
Of course you have heard about the Big Bang, the primordial explosion that created the Universe, about 14 billion year ago. As a result of this explosion the Universe is expanding and also cooling down. Proof: when we look at faraway galaxies, we observe that they are moving away from us and each other, the farther away the faster they move. And in 1965 the Cosmic Background Radiation was discovered, proof of the cooling down of the Universe.

When I was doing my PhD research, in the seventies, the Big Bang theory was widely accepted. And also that the rate of expansion should decrease with time because of the mutual gravitational attraction between all matter in the Universe. If the Universe contained enough mass, the expansion would finally stop, followed by contraction and ending in what became known as the “Big Crunch” where the whole Universe would again be concentrated in a single point. And might even start again in another Big Bang! An attractive idea in those hippie days!

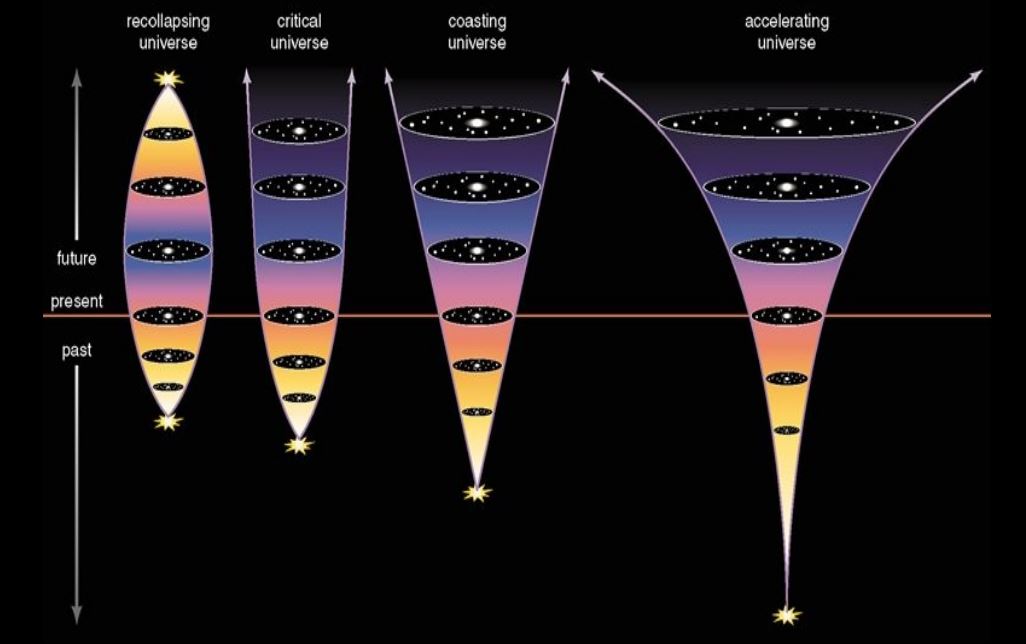
Here are the possible scenarios. In the coasting scenario there is not enough mass to stop the expansion, in the middle one there is just enough mass to stop it (asymptotically), but not enough to reverse the process (as in the left scenario)

future_of_the_universe

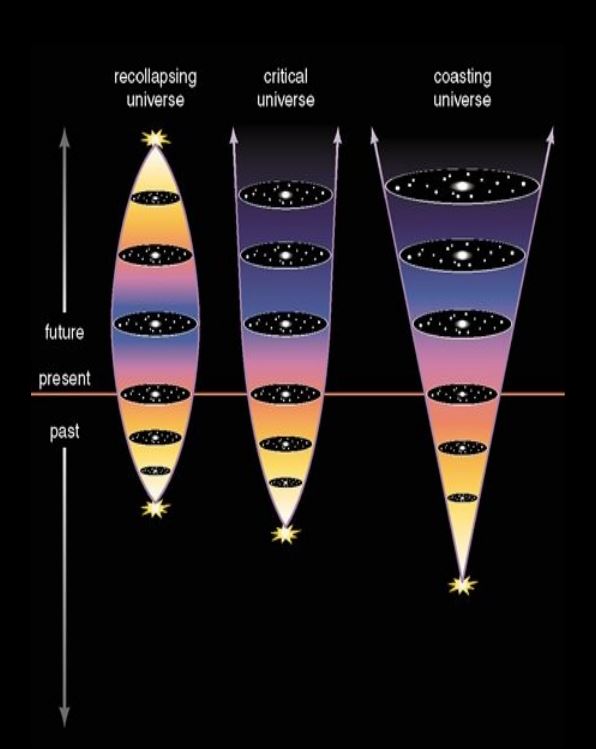
The problem was that when you counted all the visible mass in the Universe, there was just not enough to stop the expansion. It was named the “missing mass problem”.

Would it be possible to determine experimentally which scenarios was the correct one? To measure the rate of expansion, you should measure the velocity of very faraway galaxies. Measuring the velocity is not that difficult, you have to measure the Doppler shift. When an ambulance passes you, you will first hear a higher sound of the siren, and a lower sound when the ambulance is moving away from you. For light it is basically the same, here you will see a difference in colour. When a star or galaxy is approaching is, the colour is a bit bluer, when it moves away it will be redder. Measuring the “redshift” gives us the velocity.

The big problem is how to determine the distance to such a faraway galaxy! The technique used in astronomy is based on the fact that light from a light source becomes more spread out when the distance is larger. Probably every photographer is aware of this “inverse-square law”

inverse square law

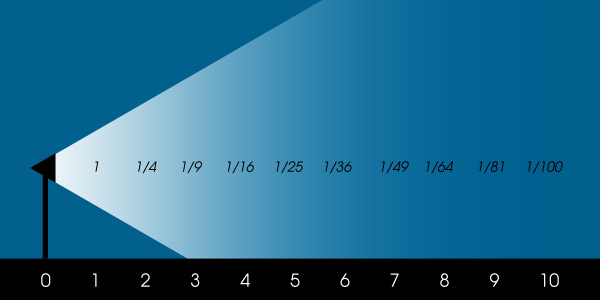
So if you know how “strong” the light source itself is, you can determine the distance by measuring the amount of light at that distance. But how do we know how much light a star really produces? In general that is impossible, because you have big bright stars and small, not so bright stars.

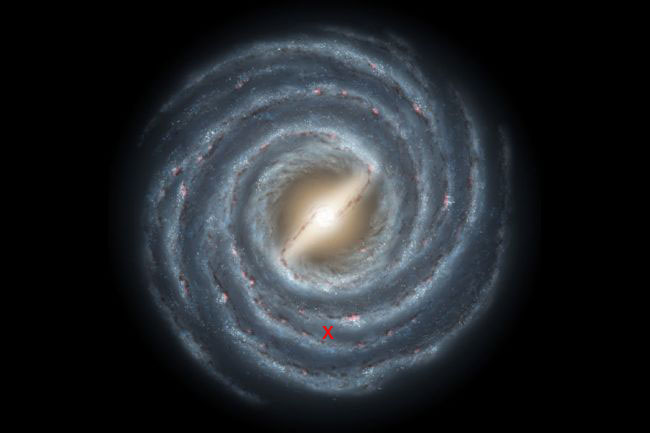
What the Nobel Prize winners did was looking at very special events, so-called (type 1A) supernova’s. A supernova is a star that explodes at the end of its life. During a few days/weeks it can produce more light than a whole galaxy. And the intensity of this light is basically the same for each supernova explosion (of type 1A). They are extremely rare events, it is estimated that in our own Milky Way they occur only a few times in a century! But when they occur, they are so bright that they can even be observed in very distant galaxies. And there are so many galaxies.

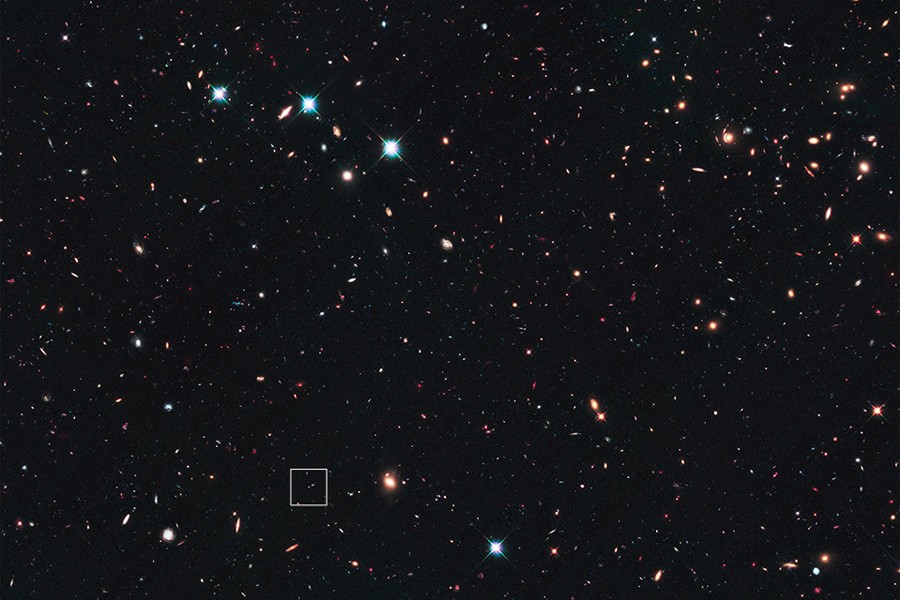
Finally we can now explain the research done by the (competing) teams of Perlmutter and Schmidt & Riess. They looked for type 1A supernovas in distant galaxies and determined the distance and the velocity. To show you how complicated this kind of research is, here is an image of a recent supernova discovery, SN Wilson. In this image a few bright points are stars, but many are galaxies. The tiny square contains the galaxy with the supernova.

supernova

Here are three enlarged images of this tiny square. The galaxy is the round spot in the center. Left image shows the situation before the supernova exploded, in the middle one the supernova has exploded. You don’t see any difference? Let the computer “Subtract” the left image from the middle one and you get the image to the right! Voila, the supernova ..:-)!

Before and after

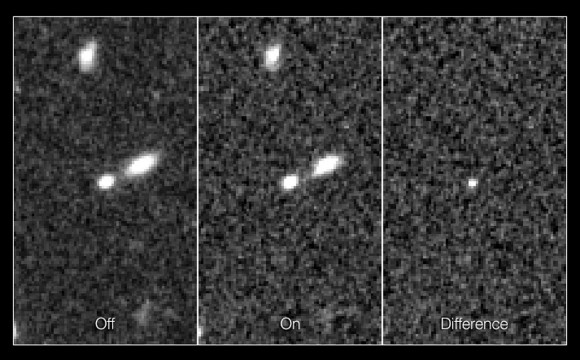
These images, taken by the Hubble telescope were taken by the team of Riess in 2010. The distance is 10 billion light year, which makes this galaxy the most distant one, observed until now.

As the light of this galaxy needed 10 billion years to reach us, we observe it now as it was 10 billion years ago! Looking far away means looking in the past. The scientists expected to find that in the past the expansion of the universe would be faster than it is now, as explained in the beginning of this post.

What they actually found, shocked the scientific world: the expansion of the Universe was accelerating . It was so unexpected that it was very fortunate that two research teams came to the same conclusion.

So there had to be a repulsive force, stronger than the attractive force of gravitation. This repulsive force is now named “dark energy” but we still have no clear idea what it is.

It is for this discovery that the two teams shared  the Nobel Prize.

The three scenarios, mentioned above are all wrong. It is the fourth scenario, shown below, that we now believe to be correct. There is even a possibility that this acceleration will increase so dramatically with time, that the Universe would end in a Big Rip, where finally, stars, planets, even atoms would be ripped apart.

accelerating universe

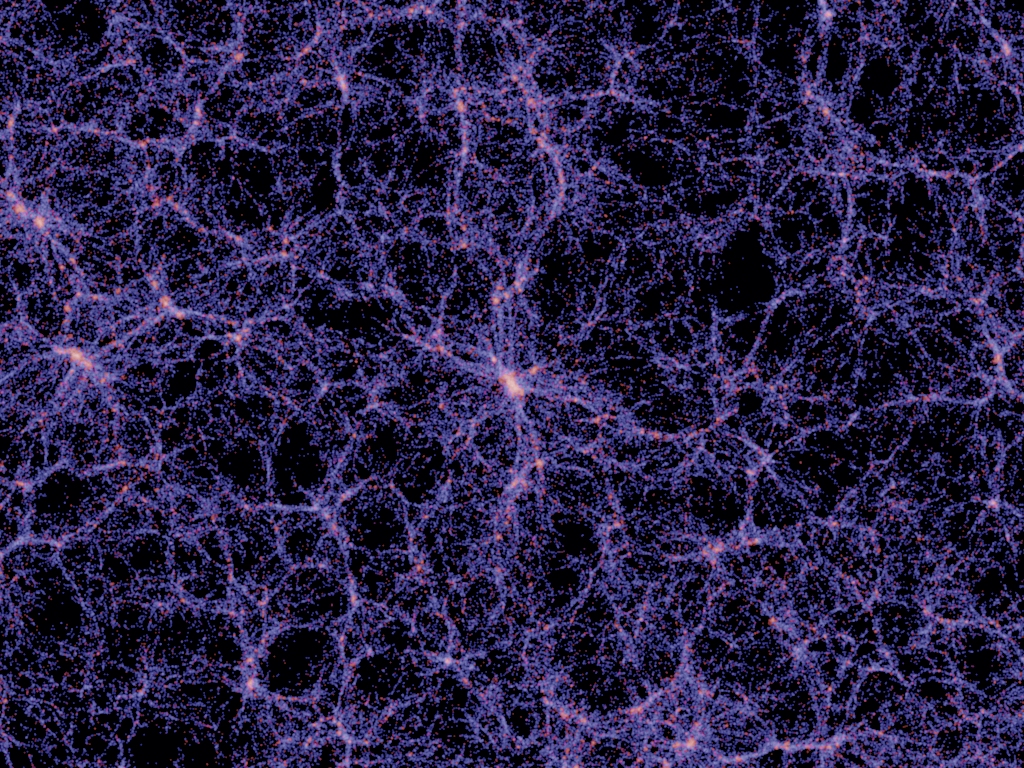
Much progress has been made since 1998, especially in the analysis of the Cosmic Background Radiation. It has confirmed that there is a repulsive force, now named “dark energy”. It has also confirmed that there is a lot of invisible matter in the Universe, now called “dark matter”. In both names “dark” describes our ignorance, at the moment we just do not know what they are. I am planning to write a separate post another time about this topic.

Let me end this post with an image that gives the distribution of “normal” matter, dark matter and dark energy in our Universe. I have seen this kind of picture numerous times, and I still find it shocking.

darkenergy_pie

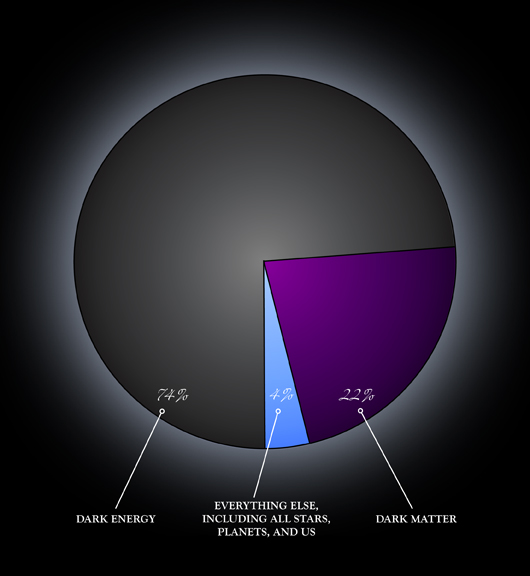
The stars, the planets, humans, everything is made of normal matter: protons, neutrons, electrons. We know a lot about it.  But it is only 4% of our Universe. About the other 22+74 % we know next to nothing at the moment!

If I could start a new life now, I would choose astrophysics and cosmology as my field of study…:-)

Several images above have been taken from this very interesting set of lecture notes.

Fibonacci (part 2)

In part 1 we have seen that the Fibonacci series can be generated by a simple rule: start with 1, 1 then adding the last two numbers of the series gives the next one

1, 1, 2, 3, 5, 8, 13, 21, 34, 55, 89, 144, 233, 377, 610, 987, 1597, 2584, 4181, 6765 ...

When you take the ratio of two consecutive Fibonacci numbers, this ratio approaches the Golden Ratio φ (phi) = 1.61803.. as you proceed in the series. And we have seen the close relation between the Fibonacci numbers and the Golden Spiral. Take note in the picture below of the rectangle containing the spiral. The ratio between width and height is φ. You will not be surprised that it is called the Golden Rectangle..:-)

Golden spiral

Has all or any of this a relation with the world around us? It is said that the Golden Rectangle is pleasing to the eye and that therefore many paintings have that format. It is said that the Parthenon temple in Athens was designed with φ in mind. There are people who believe that φ ( like π ) can be found in the dimensions of the  Pyramid of Cheops. And that the spiral arms of galaxies are Golden Spirals.

parthenonMona Lisagalaxy

The above statements are unfounded (the Parthenon) , false (painters had no preference for the Golden Rectangle) or only partly true (spiral arms of galaxies are logarithmic, but in general not golden). People who know me, will not be surprised that I am a skeptic..:-). When you are a believer, you will be pleased with the Golden Number website, maintained by “Phi Guy:” who introduces himself with “The inspiration for the site came as a result of coming to faith in God through Jesus Christ.” The guy must have taken the alternative name for φ (Divine Proportion) very literally.

This site is more to my liking: The Myth That Will Not Go Away

Often in a discussion about the Golden Spiral, the Nautilus shell is mentioned. Here it is,  a beautiful example of a logarithmic spiral in nature. But is it a Golden Spiral, does it grow with a factor 1.618 each quarter turn? The answer is negative. The golden spiral is the blue line. It is clear that it grows faster than the Nautilus! The average growth factor for a Nautilus is ~ 1.33.

Nautilus with golden spiral

Many references to Fibonacci and the Golden Ratio in  the world around us, are incorrect.

Here is one more, funny example. Recently I found on FB a picture of Fibonacci Pigeons. The location of the pigeons has been indicated with yellow arrows. Nice how the distance between the pigeons increases from left to right. But is it Fibonacci?

pigeons1

The answer is again negative. In the upper part of the picture I have indicated the Fibonacci positions. Compare the regular increase in spacing with the very irregular spacing of the yellow arrows!

Ok, time to become more positive…:-) Several painters (Dali, Seurat) were intrigued by Fibonacci numbers and the Golden Ratio. One 20th century artist, Mario Merz, was fascinated by it and you can find references in many of his works. Here are a few.

TablesMario MerzSpiral

But the most beautiful examples come from nature, from the Kingdom of Plants.

Here is a sunflower. What we call the flower is actually a combination of hundreds of small flowers (florets) surrounded by petals. As you see the florets are arranged in two series of spirals, starting from the center. One series is curving clockwise (red), the other one anticlockwise (blue). Can you count the number of blue spirals and red spirals?

Sunflower

The answer is : 55 red spirals and 34 blue ones. Two Fibonacci numbers!

Here is a pine cone, that I found in the forest a couple of years ago. Also here the scales form  two series of spirals. I counted how many and found 13 green ones and 8 yellow ones. Again two Fibonacci numbers! Isn’t it amazing? Try it yourself with a pineapple..:-)

pine cone

Is this Intelligent design? The Divine Proportion in action? The explanation is very interesting: by arranging the florets/scales this way, the available space is used the most efficiently. The idea is that new flowers/seeds are not formed in line with the old one, but rotated. If we express this rotation as part of a full turn (360 degrees), then a rotation of 0.5 would mean that each new cell is rotated 180 degrees. A rotation of 0.25 gives a rotation of 90 degrees, etc. Here are a few examples for various rotations. As you see, the result depends strongly on the chosen rotation value. For a value of 1.610, the space is used already quite efficiently.

rotations

So, let us try 1.6180, the golden ratio. We see an almost perfect filling of the space. Notice the two series of spirals and count the number in each series and you will find 13 and 21 !

rotphi

The pictures above have been created with a beautiful app, which can be found on the website Math Is Fun . Have a look, and try out other values of the rotation. You will also find there an explanation why φ is so special.

Much more can be said about the Fibonacci numbers and the Golden Ratio. A Google search gives numerous hits. Also a book has been published: The Golden Ratio: The Story of PHI, the World’s Most Astonishing Number

Fibonacci (part 1)

Let me start with a rabbit tale..:-)

Rabbits

Once upon a time a pair of rabbits was born. One month later they were mature and mated. After a pregnancy of 1 month, a new pair of rabbits was born (and being rabbits, the parents mated again immediately). In this tale rabbits have eternal life and keep mating. The question is, how does the number of rabbit pairs grow with time?

Let us do some simple arithmetic (if you are afraid of numbers, skip this paragraph)

  1. At the start there is 1 pair, just born. We call it pair A
  2. After 1 month this pair A is mature and mates, so still 1 pair
  3. After two months, pair A delivers a new pair B, so we have now 2 pairs
  4. After three months pair A delivers again a new pair C, pair B has matured and mated, so 3 pairs
  5. After four months pair A delivers pair D, pair C has matured and mates, but now also pair B produces pair E, so totally 5 pairs
  6. After five months pair A delivers pair F, pair C delivers pair G, pair B delivers pair H, totally 8 pairs of rabbits.

Complicated..:-)?  Maybe the graph below will help. Red vertical lines show mating (M), yellow diagonal ones indicate gestation and delivery  (N), black vertical ones are stable (each month producing a new pair)

rabbits

So the sequence gives (in rabbit pairs) 1,1,2,3,5,8… can you guess how it continues?

Here is the answer, each number is the sum of the two preceding ones! 2+3=5, 3+5=8, so the next term should be 5+8=13, then 8+13=21, 13+21=34. A very simple rule..:-)

Still you may wonder, who came with such a funny story. Well, that was Fibonacci, an Italian mathematician, living from c. 1170 – c. 1250.

Fibonacci

The numbers are now called Fibonacci numbers:

1, 1, 2, 3, 5, 8, 13, 21, 34, 55, 89, 144, 233, 377, 610, 987, 1597, 2584, 4181, 6765 ...

This Fibonacci series has several remarkable properties. To explain one of them, I first have to introduce the Golden Ratio, also known as the Divine Proportion!

Hm, a little bit more mathematics (skip it if you are afraid of formulas). We have to go back to the old Greek philosophers. They were fascinated with numbers and ratios between numbers. You you may remember the Pythagorean triangles from your school days! Here is one of the problems they were interested in. Suppose you have a stick you like to divide in two parts a and b in such a way that the the ratio (a + b) / a is the same as the ratio a/b

220px-Golden_ratio_line

Hm, let’s try. We have a stick of 100 cm long and we divide it in a =50 cm and b = 50 cm. Then (50+50)/50 = 2 and 50/50 = 1. Not at all the same. Next we try a = 60 and b = 40. This results in (60+40)/60 = 1.6666.. and 60/40 = 1.500. Not yet equal. Next a =62 and b =38. Result: (62+38)/62 = 1.6129.. and 62/38 = 1.6315.. Getting closer! Refining this, we finally find a division of a = 61.8034.. and=38.1966.. with a common ratio of 1.6180..  The Greek mathematicians named this ratio the Golden Ratio with  φ (phi) as its symbol.

Back to our Fibonacci numbers. Let us take the ratio of two consecutive numbers. We start with 1/1 = 1, then 2/1 = 2, 3/2 = 1.5, 5/3 = 1.666, 8/5 = 1.6, 13/8 = 1.625, 21/13 = 1.615, 34/21 = 1.6190, 55/34 = 1.6176, 89/55 = 1.6182, 144/89 = 1.6180 etc

Surprise! The Fibonacci numbers and the Golden Ratio are related!

The ratio of two consecutive Fibonacci numbers approaches the Golden Ratio !

For the second remarkable property we will visualise the Fibonacci numbers in two dimensions, as squares. We add each square so that the result will be a rectangle. The last rectangle in the picture below measures 13 by 8, ratio 13/8 = 1.625, already close to the Golden Ratio..:-)

Fibonacci.squares

Next step, in each square we draw a quarter-circle. This is the result, we get a beautiful spiral, the Golden Spiral!

golden spiral

Not surprisingly, artists throughout the ages have been fascinated by Fibonacci numbers and the Golden Ratio. And in nature we come across many examples of Golden Spirals.

But that will be the topic of a separate post.

Note for readers with a mathematical background. The spiral above is an approximation of the Golden Spiral. And the Golden Ratio can be easily calculated.

golden ratio

Finally: the Golden Spiral is a special case of a logarithmic spiral, with a growth factor of φ for every 90 degrees of rotation.

Visitors from outer space

15 February 2013: A small asteroid enters the Earth atmosphere over Russia. Mass ~11.000 tonnes, size ~20 m and speed ~18 km/s. At an altitude between 15-25 km it explodes, causing a shock wave on the ground resulting in about 1500 people hurt (mostly by scattered glass) and ~ 7000 buildings damaged. Estimated energy 440 kilotons of TNT,  equivalent to ~25  times the energy of the  atomic bomb on Hiroshima, most of it absorbed in the atmosphere. This asteroid had not been discovered before its impact.

On the same day  about 15 hours later, asteroid 2012 DA14 passes Earth at a distance of only 28.000 km (that is within the orbit of the telecommunication satellites!). Bigger (about 40.000 tonnes and 30 m), it was discovered in February 2012. Although occurring almost simultaneously, the two events are not related.

Next year, 19-10-2014,  comet C/2013 A1 will pass extremely close to Mars, with a small possibility of an impact with the planet. Here we are talking about a different order of magnitude! Estimated size of the comet nucleus is ~ 3km! IF it would hit Mars, the energy released would be in the order of millions of Megatons of TNT. For comparison, the asteroid that struck Earth 65 million years ago and ended the dinosaur era on Earth  was only about three times as powerful.

Asteroid hits Earth

Do we have to get worried? In the aftermath of the Chelyabinsk meteor there was a lot of commotion in the media that action should be taken immediately to protect us from future collisions. Suggesting that nobody had expected this. As if the scientific world was not already aware of this problem!

Those outer space objects (asteroids, meteorites, comets) that can come close to (or even hit) Earth are called Near Earth Objects (NEO’s). Because of the impact risk they are monitored already for decades. The problem is that there are many of them and that they come in all sizes. Here is a graph of their distribution. The blue line gives the number of known NEO’s, the red line is a estimate of their total number. Please note the double logarithmic scale of the graph! For example, only about 100 NEO’s with a size of ~10 meter have been observed, whereas the estimated total number is ~ 10 million!

Distribution of NEO's

At the moment about 10.000 Near-Earth objects have been discovered. About 900 of them are asteroids with a size of 1 km or larger.

Here is a table with (statistical) information about the impact of a NEO. The second row gives data for objects with a size of 30 meter. The 2012 DA14 falls in this category. The effect of impact: a fireball, a shock wave and minor damage. Fits quite well the Chelyabinsk meteor, although it was smaller. The second column gives the average time in years between impacts of this size: 300 year.

If comet C/2013 A1 would have been on a (near) collision course with Earth, it would fall in the category: Billions of people dead, global climate change. Time interval: millions of years.

Followers of my blog may remember the post about Apophis At the time of discovery there was worry that it might hit Earth. We know now that the probability of impact is negligible. With its estimated size of 300 m it would create havoc, but no global destruction.

Neo impact risk

If a NEO on collision course is discovered early enough, it may be possible to deflect it. Numerous proposals exist. See my post Paintballing Apophis or do a Google search on “deflecting a NEO

Conclusion: Earth runs a risk of an impact with a NEO. It is not a matter of IF but of WHEN. Early observation of “dangerous” NEO’s is important, so protecting measures can be taken. That is why there are global initiatives, like for example  NEOShield

Neoshield

For this post graphs, tables etc have been taken from this very informative site.

Largest structure in the Universe discovered

This will be a bit longish post…:-)

A few weeks ago an in international team of astronomers announced the discovery of the largest structure in the universe: a group of quasars extending over a distance of 4 billion lightyear (ly).

LQG

Quasars (Quasi-Stellar Radio Objects) were discovered about 50 years ago. They look like stars but are so distant (billions of ly away) that they can not be stars. Now we know that they are active nuclei of galaxies, surrounding a massive black hole in the center. Billions of ly away means that we observe them as they were billions of years ago  when the universe was still young.

More than 200.000 quasars are known at present. Some of them occur in (large) groups, called LQC‘s.The group that has now been discovered has 72 members (the black circles in the image). The red crosses form another, smaller group.

So, why is the discovery of this large group of quasars so exciting? To make that clear, we have to talk about the cosmological principle and the large-scale structure of the universe.

Long it has been thought that the Earth was the center of the Universe. Then it was discovered that Earth is one of several planets orbiting a star, the Sun. It is the blue marble in the image below. It is not in scale, light needs only 8 minutes to travel from the Sun to Earth, and more than four hours to reach the outermost planet Neptune.

The Solar System

Is the Sun the center of the Universe? No, the Sun is one of several hundreds of billions of stars in our galaxy, the Milky Way.  Some of you may have seen the Milky Way on a cloudless clear night far away from cities, as a white band of light across the sky. Here is an artist impression of the Milky Way as seen by an observer from outer space. The approximate location of our Sun has been indicated with a red cross. The diameter of the Milky Way is about 100.000 ly.

The Milky Way

Is then the Milky Way the center of the Universe? Again negative! Our Milky Way is just one of hundreds of billions of similar galaxies.  The scientists now think that the Universe has no center! From each location and in each direction the Universe looks the same, if you observe it on a sufficiently large scale. This is called the Cosmological Principle

So, what is a sufficiently large scale? If the galaxies would be randomly distributed in the Universe, we would not need to zoom out further. But that is not the case! Our Milky Way is a member of a group of more than 50 galaxies, bound by gravity. It is called the Local Group. Most of the galaxies in this Local Group are small ones, with the exception of our neighbour, the beautiful Andromeda galaxy.

Andromeda

Andromeda is bigger than the Milky Way, may contain one trillion stars and is located at a distance of 2.5 million light-years from our galaxy. Here is a “3-dimensional” sketch of the local group.

Local Group

The size of the Local Group is in the order of 10 million ly. Many more of these galaxy clusters exist, for example the Virgo Cluster, much bigger than our Local Group, consisting of more than 1000 galaxies, at a distance of 54 million ly.

Here is the Virgo Cluster. All the fuzzy blobs are galaxies, the light points are stars in our own Milky Way. Click on the image to enlarge it and take a few minutes to think about the meaning of life..:-)

Virgo-cluster

We still have to zoom further out. Our Local Group, the Virgo Cluster, the Fornax cluster, the Eridanus cluster and about 100 more are part of an even larger collection, the Virgo Supercluster . Here is one more “3-dimensional” sketch of this supercluster.

Virgo Supercluster

You will see the Local Group in the center, the Fornax and Eridanus clusters and many more. We are talking now about a size of more than 100 million ly already!

Many more superclusters have been discovered. Could it be that these superclusters of galaxies are randomly distributed in the Universe. Let’s zoom out one more time! The image below shows the superclusters around us within a distance of 1 billion ly. So the width of this image is 2000 million ly.

Superclusters

Obviously this is not a random distribution. Clusters and superclusters are aligned along filaments filaments, with in between large portions of space almost without any galaxies. It  looks like a kind of foam-like structure and is sometimes called the Cosmic Web. In the center you notice the Virgo supercluster. Keep in mind the zooming out steps we have made to reach here! Earth → Sol → Milky Way → Local Group → Virgo Cluster → Virgo Supercluster → Cosmic Web.

Do we need to zoom out more? According to the present cosmology theories: NO. Computer simulations starting from right after the Big Bang show that this foam-like structure on a scale of hundreds of millions of light-years is to be expected. Starting point for these simulations is the measured Cosmic Background Radiation CMB), as depicted in the image below.CMB radiation

To explain the relation between this CMB image and the large-scale structure asks for another post…:-).  Basically the Standard model of Cosmology is used, including the effects of Dark Matter and Dark Energy. Here is a typical result of such a simulation. The image has a width of 1500 million ly  The bright nodes represent Superclusters. You will notice strings of galaxies and voids, quite comparable to the real Universe. At this scale, the Universe looks basically everywhere the same.

Cosmic Web

We started this post with the discovery of a group of quasars extending about 4000 million ly. Quasars are nuclei of galaxies, so in the terminology used above, they would form a “cluster”. But a cluster of this size would not fit in the above image at all!

This explains the excitement among astronomers and cosmologists. Is the Standard Model of Cosmology wrong?

Let’s wait and see!

Several images in this post come from a fascinating website: An Atlas of the Universe

Doomsday 2012 and the Sun

The Mayan Long Count calendar ended on 21-12-2012. Actually it did not really end, but a new cycle started on that date. So 21-12-2012 can be seen as Mayan New Year’s Eve. The next one will be on 26-3-2407.

Quite a few people expected that the world would end on this day. Sad. Suddenly Nibiru would show up behind the moon and destroy Earth, or the magnetic field of Earth would suddenly reverse, etc.

Here is a picture of the Sun, apparently taken just after “Doomsday”. It looks like the Sun is winking…:-). The picture comes from a recent newspaper article, personally I doubt if the picture is authentic, especially the “lips” I find suspicious.

Doomsday Sun

In the past I have published several posts about the Sun. It will reach a maximum in its 11-year sunspot cycle, next year. It is becoming clear now that this maximum will be very low. Here is a picture updated until December 2012.

ssn_predict_l

The expected maximum of around 72 will be the lowest since 1906. Nevertheless Michio Kaku , the physicist “who would kill his mother to get publicity” (quote by me, LOL) is warning about solar storms that might create havoc on earth.

My ancestors

As you probably know, our species, homo sapiens, evolved, 200.00-150.000 years ago in Africa. From there they migrated all over the world. All humans living now, have  common maternal  and paternal ancestors.

How do we know this? By studying mutations in our DNA!

The idea is simple. Every now and then mutations occur in our DNA. If a mutation occurs in the DNA of an individual, will this mutation also be present in the DNA of its offspring? In the reproductive process the genes of father and mother are mixed, so that is difficult to say. There are however two exceptions!

One is the Y-chromosome, which inherits exclusively from father to son.The other one is the DNA in the mitochondria, the power plants of a cell. They come from the egg, and therefore from the mother.

By studying the mutations in the Y-chromosome we can trace back our paternal lineage to the Y-Chromosomal Adam. And in the same way, studying the mutations in the Mitochondrial DNA, we  finally go back to Mitochondrial Eve

Here are the approximate migration patterns for the paternal lineage. When you click on the picture, you will get an enlargement, where you can see the numbers in the various branches, like M173, M175, etc. This are the markers for specific mutations in the Y-chromosome. In the table estimates are given when this mutation took place. People with the same mutation in their genes are said to belong to a haplogroup

Last year, surfing the Internet, I found the website of the Genographic Project, managed by National Geographic. For 99 USD you could order a DNA ancestry kit to determine either your paternal or your maternal lineage.

As I was just reading the impressive masterpiece by Richard Dawkins, The Ancestor’s Tale, I became interested and ordered a kit. Here I am taking a swab to collect some DNA from my cheek.

The kit contains a code number that you can use to check the progress of the analysis.

After about two months I got the result. My haploproup was R1B. Nothing special actually, the majority of Europeans belong to this group…:-)


Here is the migration path of my (paternal) ancestors. About 50.000 years ago my paternal ancestor (M168) left Africa. His descendants traveled through the Arabian peninsula to Central Asia. They were hunter-gatherers, following the big game through the savannas, until they (M45) reached the big mountain ranges of Hindu Kush and Himalayas.

About 30.000 years ago, a branch split off with a new mutation (M207) and traveled to the West.  Keep in mind that they were not tourists, their movements were mainly determined by climate change and the availability of food!

In Europe this “Cro-Magnon” tribe met the Neanderthal people, which they outcompeted by their better skills and tools.

So that is my paternal lineage. Actually we ordered two sets, also one for Aric. His haplogroup turned out to be O, also nothing special, shared by the majority of Chinese in Southern China. It is interesting to see where our lineages split! In the image below I have combined our migration routes. The split occurred about 35.000 years ago in what is nowadays Tajikistan. In those days and in that region there has lived a man who is the (male) ancestor of both Aric and me. I find that fascinating.

So fascinating, that we ordered two more sets, this time to find out more about our maternal lineage.Here are the results combined in one picture.

Aric’s mtDNA haplogroup is D, mine is H Our common great……….great-grandmother migrated from Africa about 70.000 years ago. Still in Africa, about 65.000 years ago a split occurred, much earlier than in our paternal lineage. Aric’s maternal ancestor migrated far north to central Asia and Siberia. Members of haplogroup D eventually reached the Behring street and arrived in the Americas, about 15000 years ago

My maternal ancestors did not migrate as far east as my paternal ones, they remained in West-Asia and later migrated north across the Caucasus mountains into South-Russia and from there into Europe.

It is possible to make a more detailed (and more expensive) analysis of the mutations in the DNA, but for us this is enough. We know now, that we are family, LOL.

Mind you, our common maternal and paternal ancestors were NOT married, they did not even live in the same time! If you want know how that is possible, you should read Dawkin’s book.

Paintballing Apophis!

Before I started blogging, I wrote emails to a group of friends, interested in science. Several of these emails I have, after editing, entered as posts for my blog.
The first email (and now the first post on this blog) was about Apophis, an asteroid, that will pass Earth in 2029 at a close distance, and might (with a chance of 1 to 250.000) collide with Earth 7 years later, in 2036

This is an artist impression of Apophis, diameter ~ 270 m with an estimated mass of 27 megatonnes.

A collision with the earth would be a catastrophe. The impact would be the equivalent of 900 megaton TNT, ~ 60.000 Hiroshima atomic bombs.


When Apophis was discovered in 2004, there was a brief period of concern that this asteroid might hit Earth in 2029. It will not, and even in 2036 the chance is almost neglegible

But there are thousands of asteroids with orbits that may bring them close to Earth, so called NEA‘s, and NASA has an observation program to monitor them.

What to do when an asteroid is discovered which is on a crash course with Earth? We will have to deflect it! How? Many solutions have been proposed. Send a rocket to the asteroid and detonate a nuclear bomb, or let the rocket crash itself against the asteroid. Or use a strong laser beam to deflect the course.When you do this while the asteroid is still far away, a tiny change in course could be sufficient.

For a couple of years already a yearly competition “Move an Asteroid” is organised by the Space Generation Advisory Council , for students and young (space) professionals.

This year the competition was won by a MIT graduate student, Sung Wook Paek.

His winning proposal:

Launch a rocket, with a cargo of 5000 kg of pellets, filled with white paint. When near the asteroid, fire two salvos of pellets, timed in such a way, that the (spinning) asteroid will be completely covered with a very thin layer of white paint.

Here are two screenshots of a YouTube clip, published by MIT. In the left picture two pellet clouds are approaching the asteroid.  In the right picture one cloud has painted one half of the asteroid white already.

The colliding pellets will change the course of the asteroid a little bit. That is not new, but the white paint is. The photons from the sun will reflect against this bright white surface, and this results in (additional) radiation pressure. Also a tiny effect, so this kind of action should be taken, many years before the asteroid comes close to the earth.

Cosmic paintball, what a nice idea!

God’s particle

About three months ago CERN has announced the discovery of the Higgs boson, a.k.a. the God Particle. Several of my friends have asked me if I, being a physicist, could explain what it was all about. I tried, but it was not easy.

Here is another attempt…:-)

Let me start with an overview.

In the 19th century it became increasingly clear that matter is composed of molecules, and that molecules themselves are composed of atoms. Only a limited number of different atoms exists, ninety occur in nature, quite a few more have been made in laboratories. Imagine the tremendous simplification, everything around us is composed of these building blocks!

The periodic table of elements. Uranium (92) is the heaviest element found in nature. Promethium (61) and Technetium (43) are radioactive and not found in nature, giving a total count of 90 elements occurring naturally.

A monumental breakthrough took place in the 20th century, when it was discovered that atoms themselves consisted of only three (!) elementary particles, protons, neutrons and electrons. Protons and neutrons in the nucleus of the atom with electrons orbiting around this nucleus. Just a matter of numbers. Carbon with 6 protons and 6 neutrons in its nucleus and 6 electrons around this nucleus. Add one of each, and you get Nitrogen, do this again and you get Oxygen.This amazing simplicity was one of the reasons I decided to become a physicist. Even a nuclear physicist..:-)

Actually two more particles had to be added to the list. Light also consists of particles, called photons. And some of the elements are not stable but radioactive, the nucleus can send out an electron and at the same time another particle, called neutrino. Everything controlled by four forces. The strong nuclear force, keeping the protons and neutrons in the nucleus together, the electromagnetic force, keeping the electrons in orbit, the weak nuclear force, responsible for the radioactivity and, finally, the force of gravitation.

But this is not the end of the story, soon it became more complicated again! In cosmic radiation, and also in laboratory experiments (using powerful accelerators to let elementary particles collide), new particles were discovered. Not stable, often only living for split seconds, before decaying in other elementary particles. They were named muons, pions, hyperons, a confusing multitude.

It was discovered that protons and neutrons were actually NOT elementary particles, but that they were composed of “quarks”. Not just one, but several families of quarks. Bound together by “gluons”. And the electron and the neutrino were accompanied by other particle families, the muon electron, the tau electron, with corresponding neutrino’s. The strong nuclear force is actually the force between the quarks, with three quarks forming a proton or a neutron.

It has also been discovered that the elementary forces are carried by “force particles” and that the photon is actually the force particle of the electromagnetic force. One of the big successes of the last decades, was the experimental observation of the “weak nuclear force” carriers, the W and Z bosons.

All these experiments lead to what is now called the Standard Model. Three families of quarks, three families of ‘electrons’, three elementary forces with their force particles. This leaves out until now gravitation. That is actually a big problem, but we will not discuss it here

The Standard Model. Gravity is not taken into account. There are three quark families (up-down), (charm-strange) and (top-bottom). And three “lepton” families, electron, muon and tau, with their corresponding neutrinos. Finally the force particles, photon, gluon and the (W,Z) bosons

All the particles in the picture above have been “observed”. Observed in quotes, because these particles are so short-lived that their existence must be concluded from the traces they leave behind when they die…

Much more complicated than the simple “proton-neutron-electron” model, but definitely one of the most impressive results of modern physics.

One problem remains. All these particles, the quarks, the leptons, the force particles, have mass. Some are heavy like the quarks, some are light like the leptons, the photon has no mass, the neutrinos almost nothing. Why?

In 1964 Higgs and a few others came with a theory. There might exist another force field, permeating the universe, acting as a kind of “syrup”, slowing down other elementary particles and in that way giving them inertia ( = mass!). But if that field existed, it should have its own force particle, the Higgs boson. Nicknamed the God particle, because it gave mass to all the other particles.

The theory was widely accepted, so the search for the Higgs boson was on. A fierce competition resulted between CERN and the Fermilab in USA.

It now looks like it has been found. With a mass about 130 times the mass of the proton. And so short-lived that I have not even been able to find an estimate on the Internet. So you have to look at the traces it leaves behind when it dies. Here is an artist impression.

And here is a picture of the experimental setup at CERN (the ATLAS experiment) Try to spot the human figure in the picture!

This is ATLAS, one of the four experiments at the Large Hadron Collider of CERN.

Is our understanding of the physical universe now complete? No way!

As mentioned before, there is still the problem left to combine the Standard Model with gravitation. Maybe string theory, but not everybody is convinced that this will be the solution.

There is a much bigger challenge. During the last decades it has become convincingly clear that there has to be more in our universe than quarks, electrons, photons, etc. Let’s call this “normal matter”. From what we know about the Big Bang and from the way our universe is expanding after the Big Bang, we now are sure that there are two more constituents of our Universe. There has to be “Dark Matter“, until now invisible. And there has to be “Dark Energy“, a repulsive force that actually accelerates the expansion of the Universe. That’s about all we know at the moment.

A small correction to the Standard Model? Absolutely not! Here is the present estimate. Normal matter takes only 4% (!). The rest is basically unknown at the moment!

We know a lot about the 4% normal matter and next to nothing about the rest!

A sobering thought. But also exciting. There is still a lot to discover and explore in our physical universe. And for the ambitious among you: a lot of Nobel Prizes to win!