In two earlier posts I have reported about the exciting space adventure of Rosetta, a spacecraft launched in 2004 with as destination a comet, the 67P/Tsjoerjoemov-Gerasimenko. The first post, Wake up, Rosetta!, described how, after a hibernation of more than two and a half years, Rosetta woke up in January 2014, according to plan.
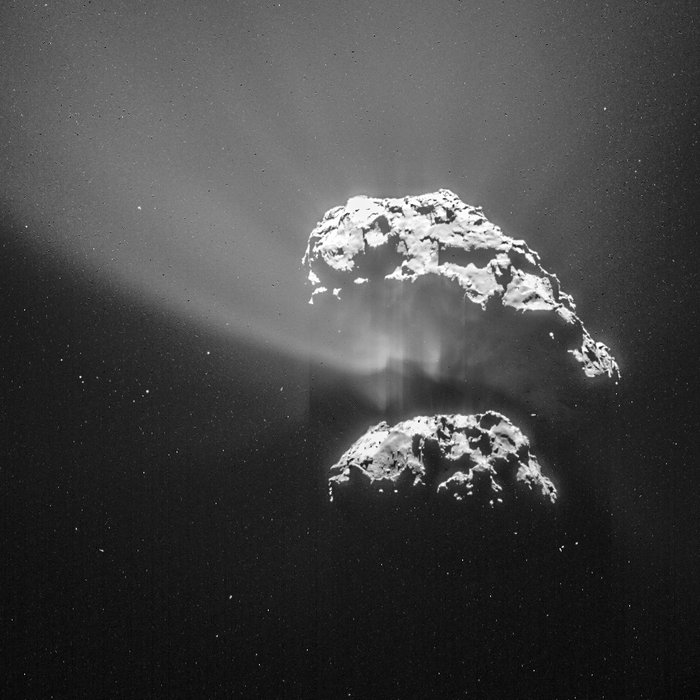
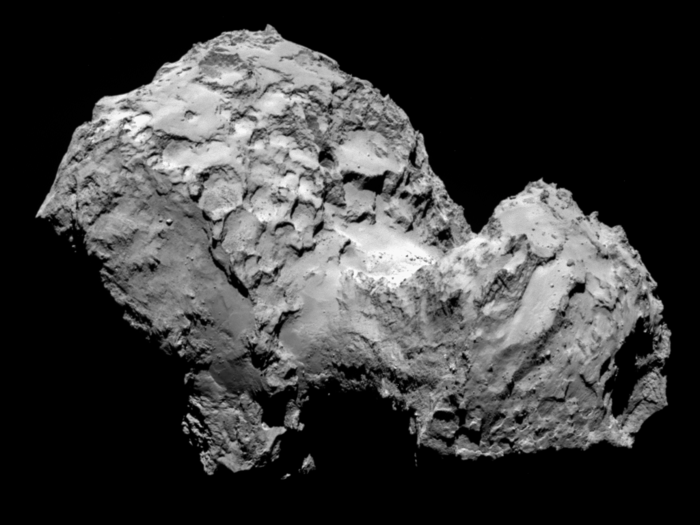
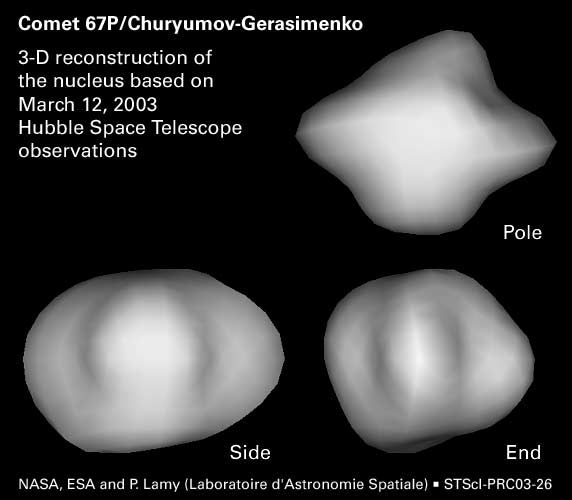
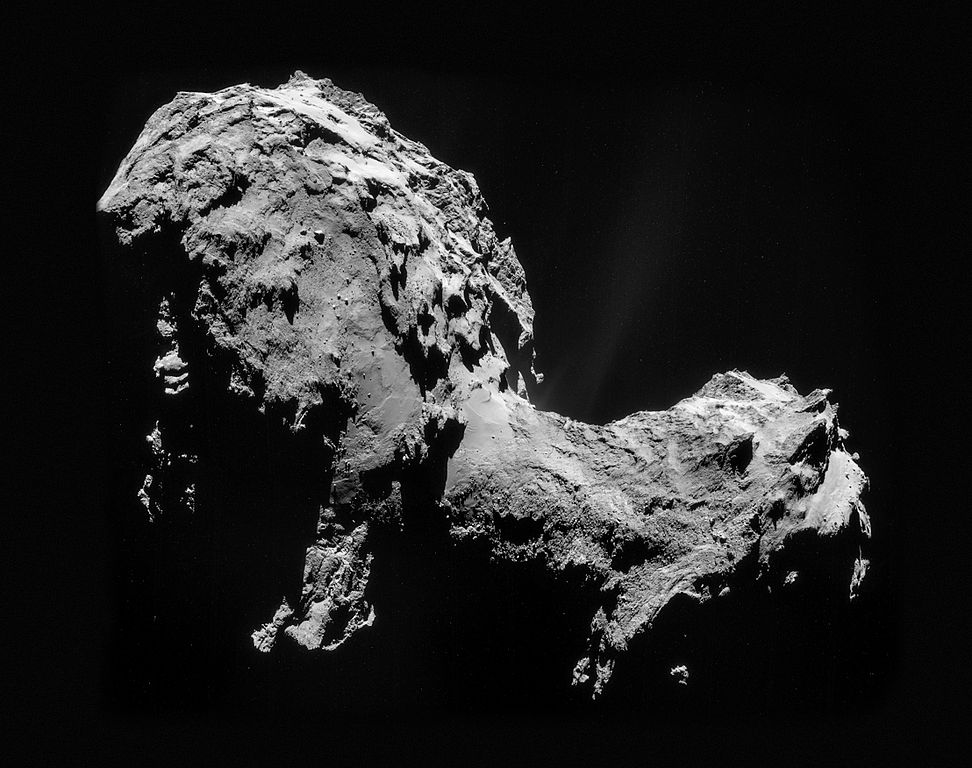
The second post, Rosetta meets 67P, published last August, reports how Rosetta successfully goes into orbit round the comet. It turns out that the comet has a strange shape, like a rubber bathtub duck. Here is a picture, taken on 19 September at 28.6 km from the center of the comet. The head points to the right. If you look carefully you will see a kind of smoke coming from the “neck” of the comet. That is the coma, part of the comet material is evaporating because it is approaching the sun. Later, closer to the sun, 67P will develop the characteristic comet “tail”. The comet is rotating with a period of 12 hours and 36 minutes.
The last few months the scientific instruments on board Rosetta have already been busy. For example analysing the composition of the “coma” smoke. With interesting results, finding not only water and carbon dioxide, but also methanol, ammonia and hydrogen sulphide. Here is an interesting blog about The “perfume” of 67P. Quote: If you could smell the comet, you would probably wish that you hadn’t
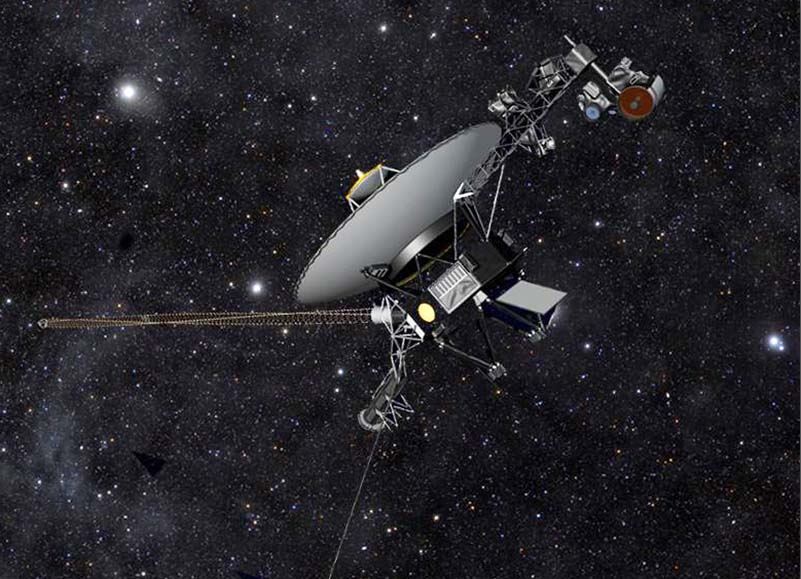
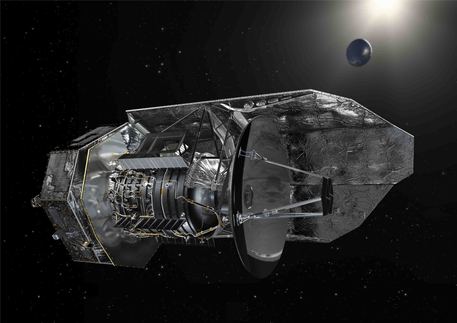
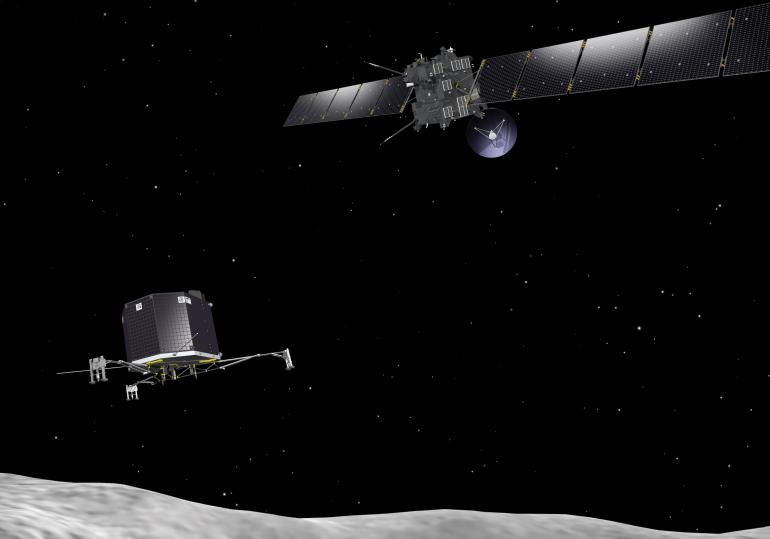
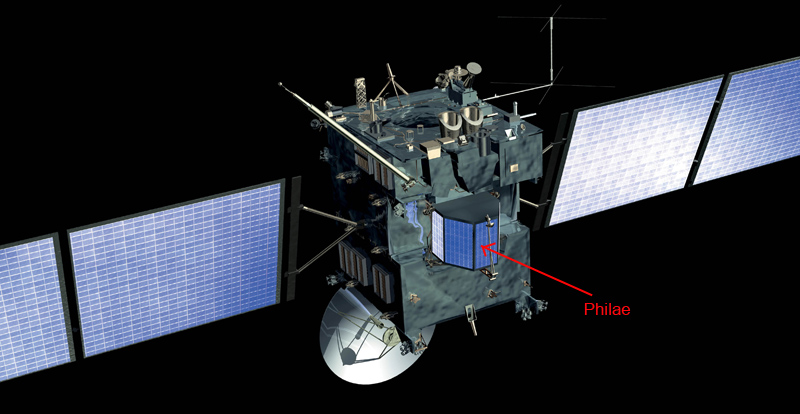
But the ultimate goal of the expedition is to land a module on the comet itself! This module has been called Philae and you can see it here still attached to Rosetta.
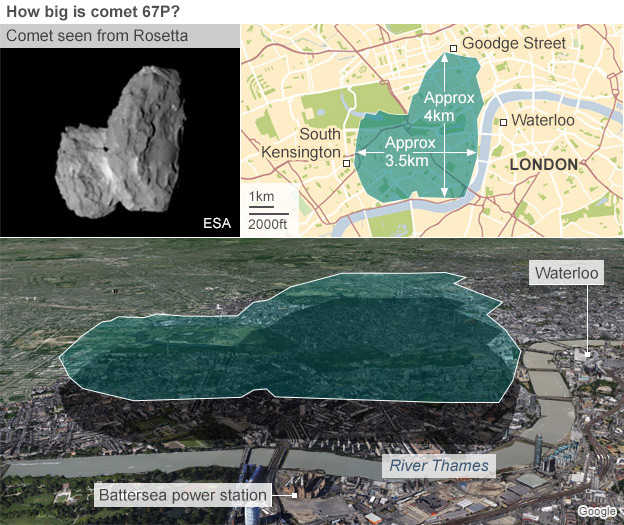
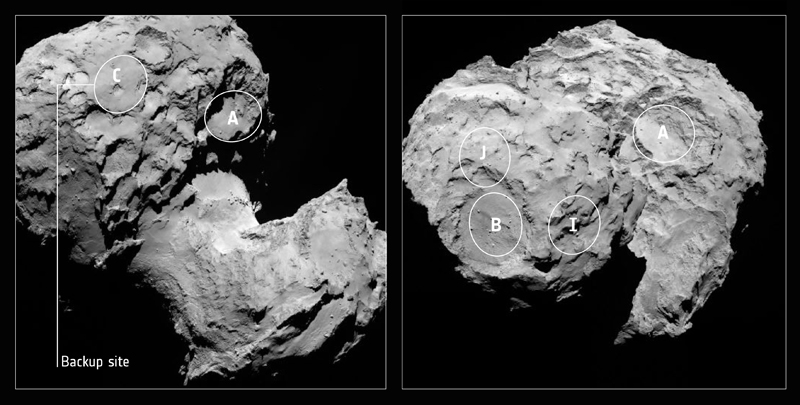
The last few months, the scientists have been working hard to find a suitable landing site for Philae. That has not been a simple job, because of the complicated structure of the comet. The landing site should be relatively flat and smooth. Several options have been studied, finally the decision was made to choose location J, on the head of the duck in the picture below.
The landing site has now been renamed Agilkia. Why? Google and find out yourself 🙂 Hint: there is a relation with Rosetta and Philae.
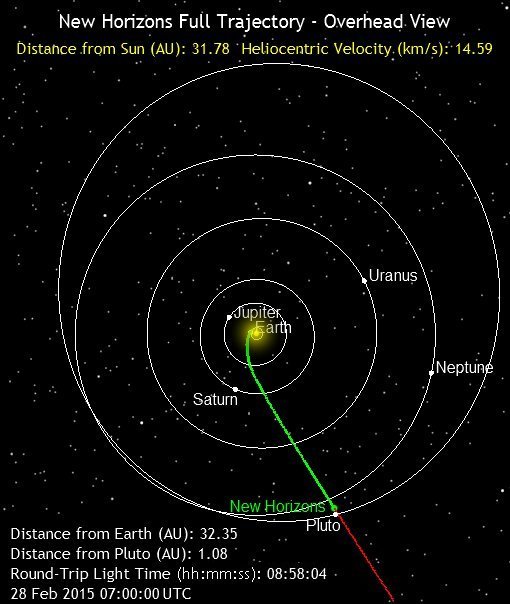
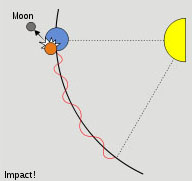
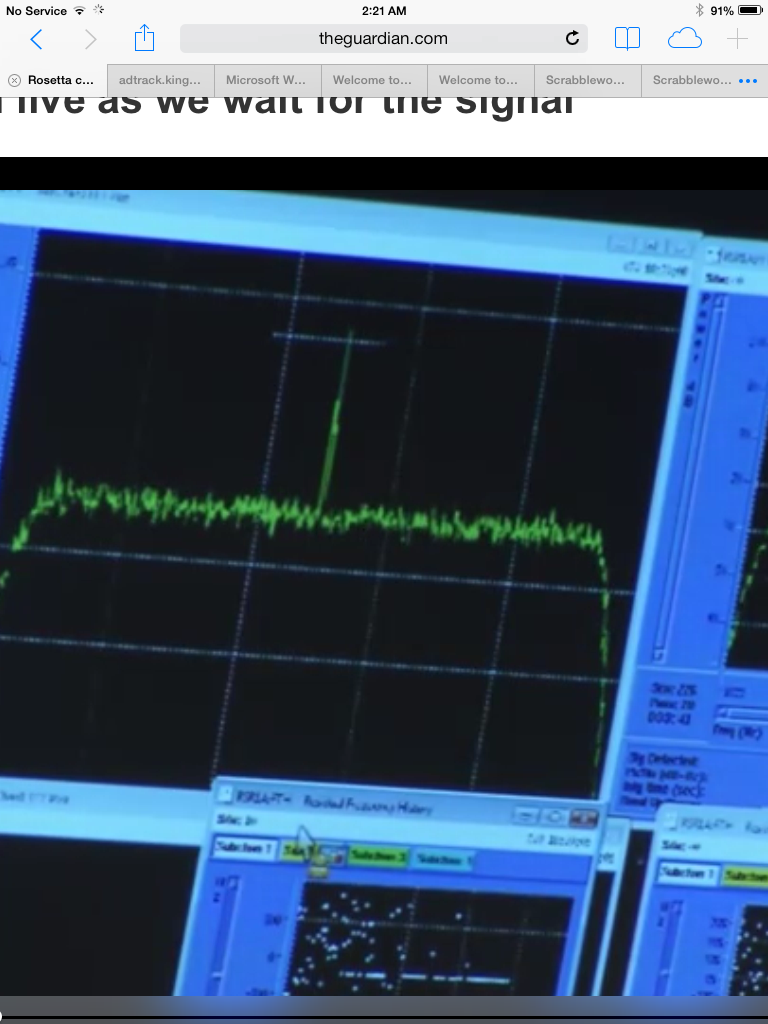
The critical landing operation will take place on Wednesday November 12. At 8:35 GMT Philae will be deployed from Rosetta and start its slow fall to the comet. It has no thrusters that can change its course, so ultimate precision is required in the timing of the separation. Keep also in mind that the distance between earth and the comet is at the moment about 500 million km, so signals take time to reach Rosetta. To be exact: 28 minutes and 20 seconds one way! So it will be 9:03 GMT before we know if the separation has been successful.
Falling to the comet? Yes, because the gravitational attraction of the comet is very small, but it exists. The falling proces willl take about 7 hours! And the speed at landing will be “only” ~ 1m/s. For comparison, that is the speed an object would get here on earth, when it falls 5 cm!
As soon as Philae touches the surface of the comet, two harpoons will be fired down to anchor the module. Otherwise it might bounce back into space! Here is an artist impression of a successful landing.
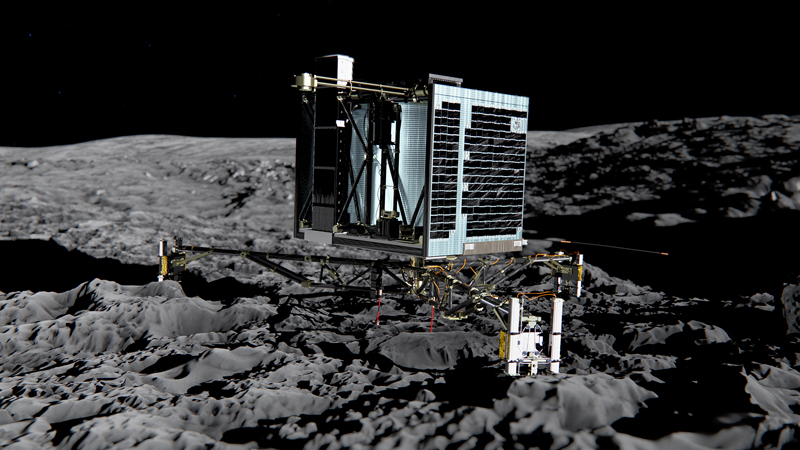
The two red lines under Philae are the harpoons. The construction of the three supporting “legs” allows landing on moderate slopes. If the slope is steeper than 30 degrees, the Philae might topple over, resulting in failure. The whole procedure is considered a risky one, success estimates of 75% “only” have been mentioned..
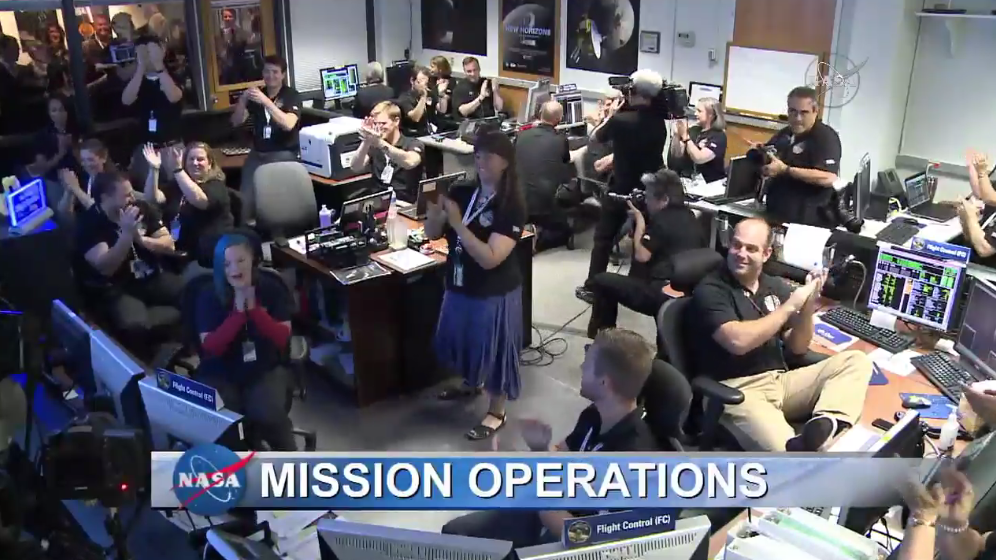
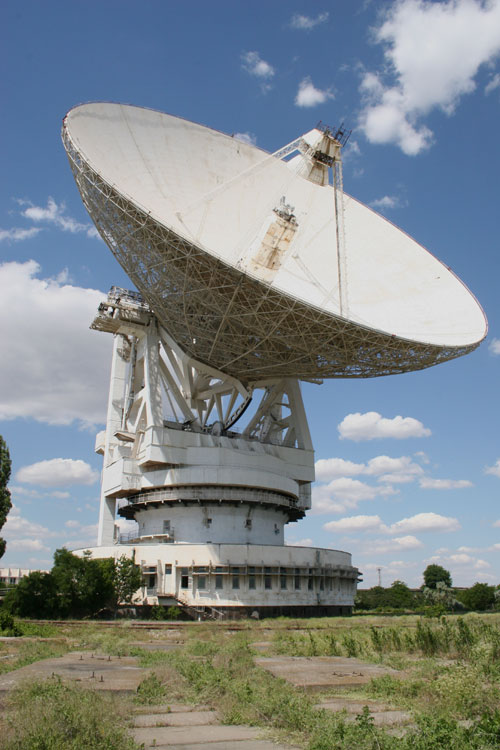
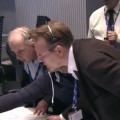
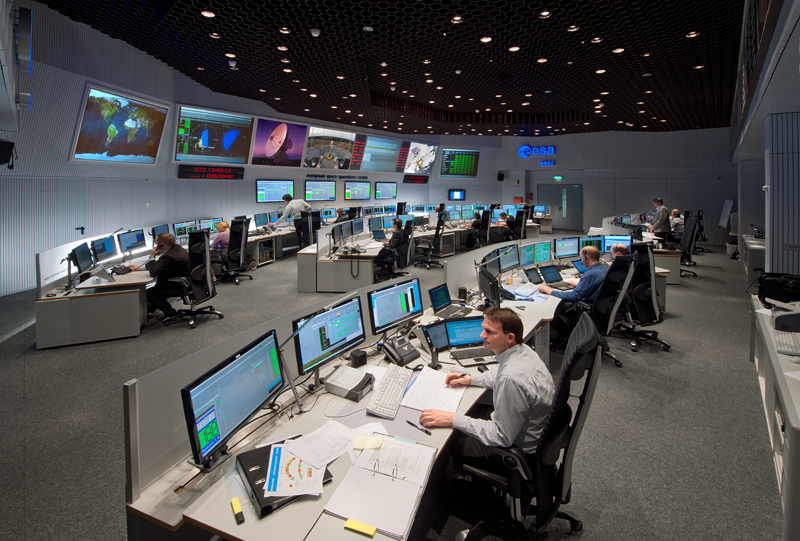
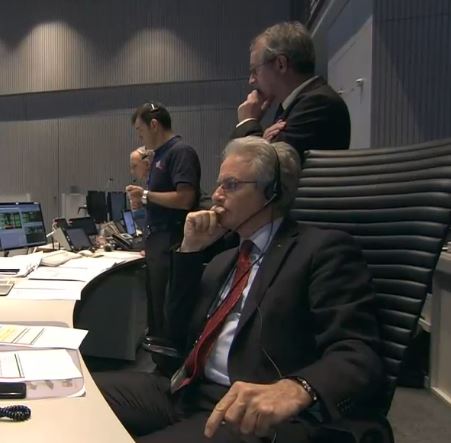
So let us keep our fingers crossed Wednesday! Malaysian time is GMT + 8 hrs, Dutch time is GMT + 1 hr. Here is the ESA control room. How many nails will be bitten on that day, waiting seven hours, while you can do nothing…:-)?
On Wednesday there will be a live broadcast of the landing procedure
UPDATE 12 NOVEMBER
5am GMT
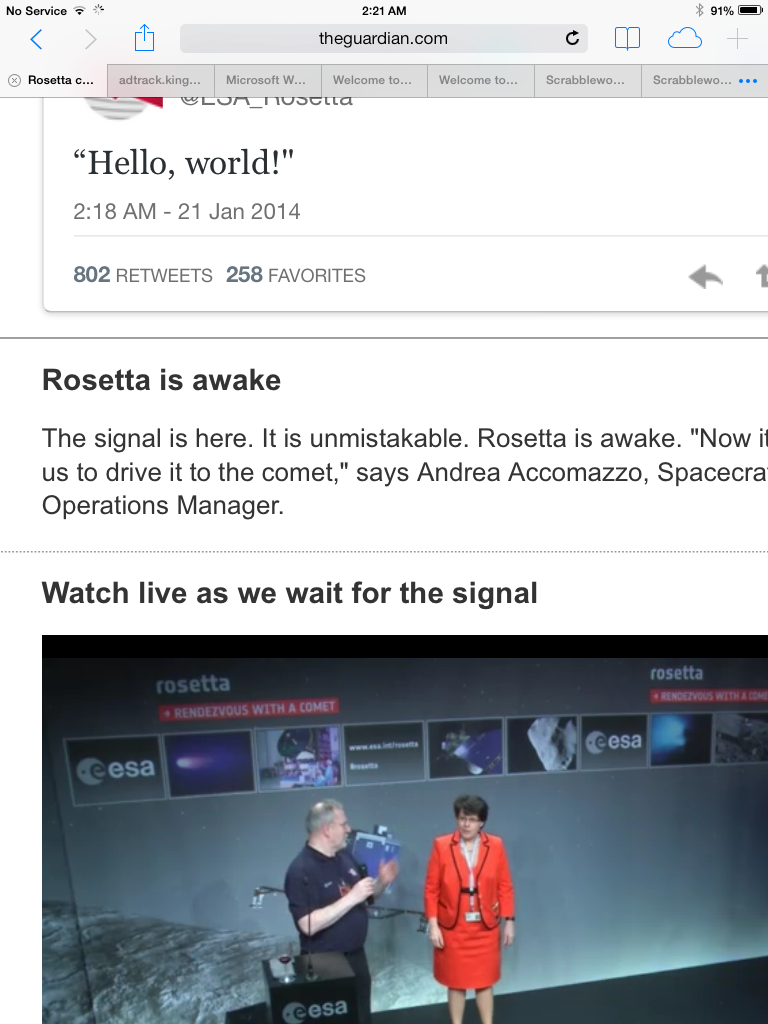
The Live broadcast has started already. It is still early in Darmstadt, people are arriving in the ESOC control room, where it is obviously quite cold…:-) Many sniffy people.
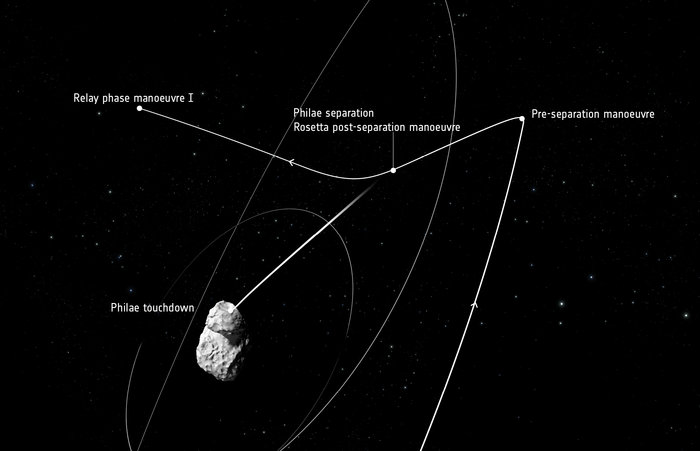
Here is a diagram of what will happen today. As I explained in my post, after separation Philae will “fall” to the comet. No course correction possible after separation, so utmost precision is needed
.
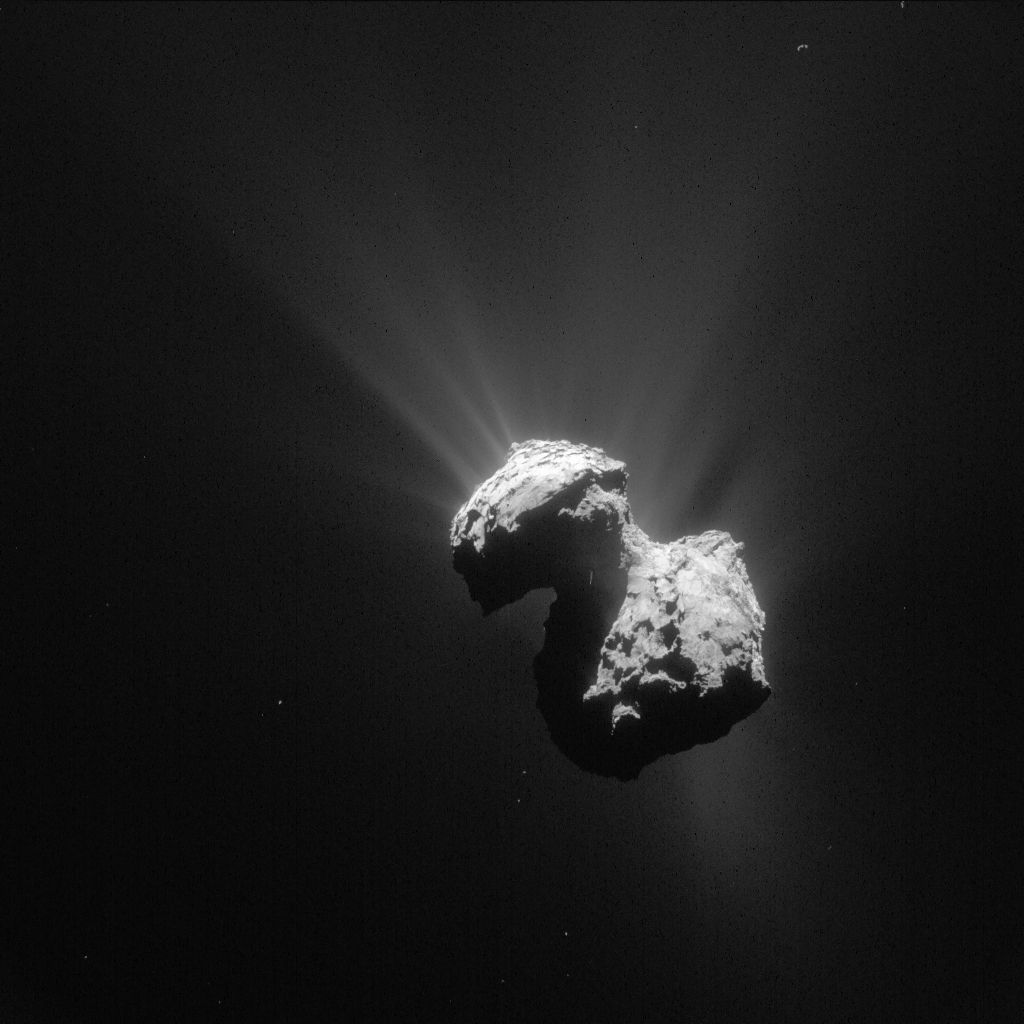
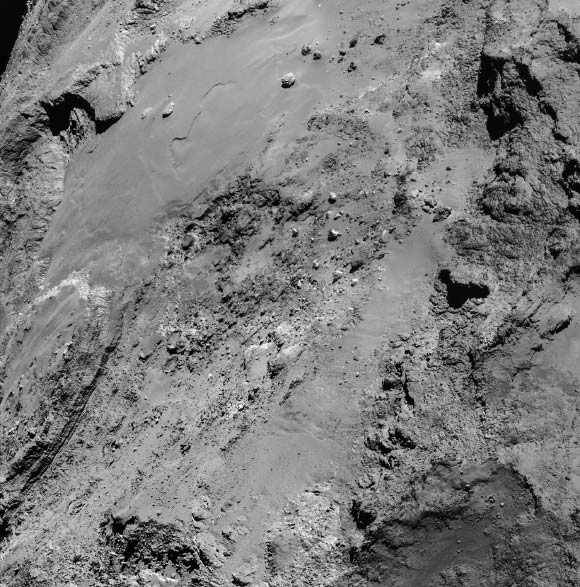
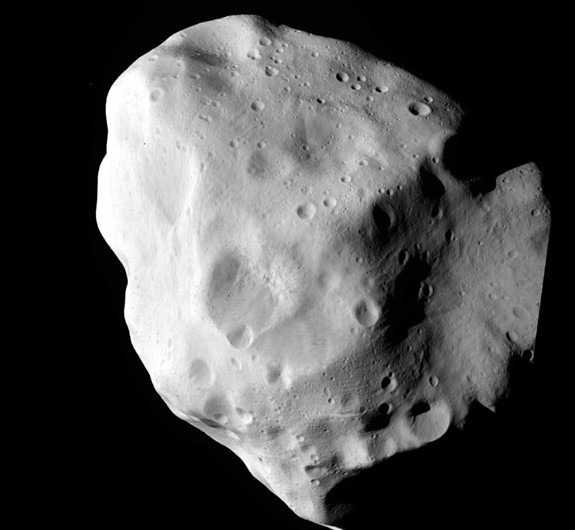
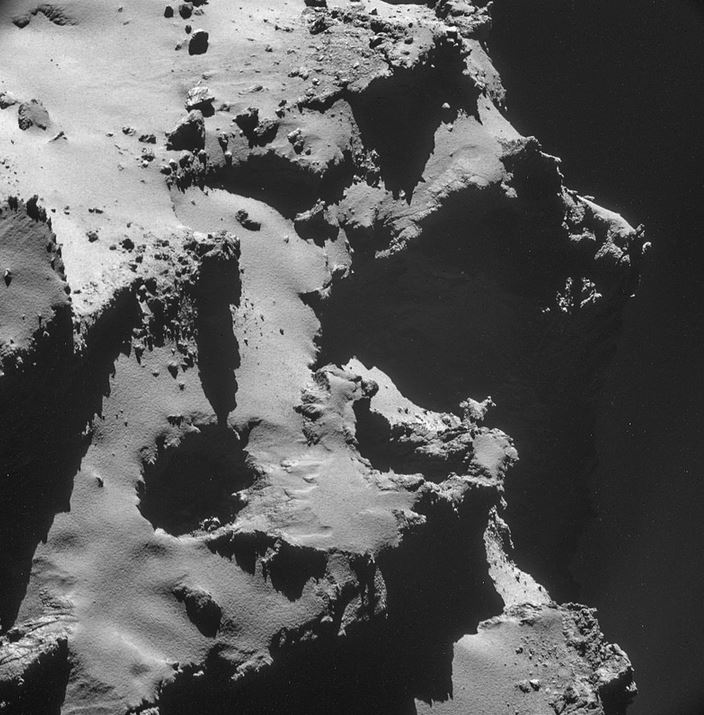
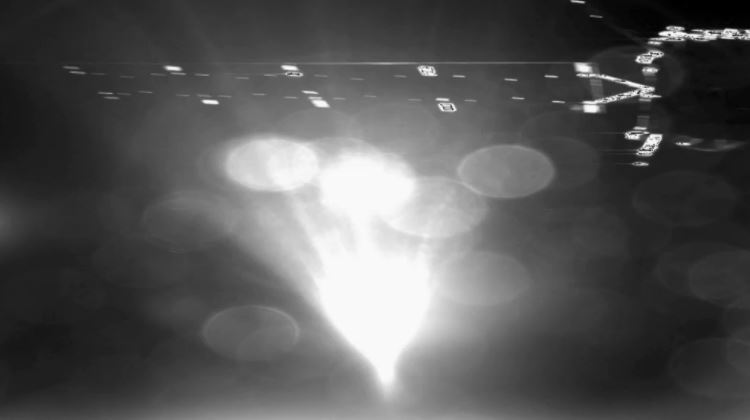
The last few days pictures have been taken by Rosetta with amazing details. Click here for a collection. Here is a spectacular one.
7:30 GMT
Just watched an interview with Gerhard Schwehm, mission manager of the Rosetta project. Now retired. I did not realise that the project started in 1985, almost 30(!) years ago. Less than one hour now until separation.
8:05 GMT
I have been naive..:-) Thinking that at this moment the command should be sent to Rosetta to deploy Philae (because it takes 28 minutes for the signal to reach Rosetta). But of course they will not do it that way..:-) Rosetta has been programmed to deploy Philae at 8:35am ! Around 9am GMT the ESOC will know if that separation has been successful.
8:35am GMT
At this moment, 511 million km away, the Philae is starting its fall to the comet 67P. In spite of a problem that has been found in the lander. As explained in my post, the Philae could bounce back after touching the surface of the comet. Therefore two harpoons are fired at touchdown to anchor it. Also, on top of the Philae, an amount of gas should be released, giving the Philae an extra push to the surface. It seems that this “thruster” doesn’t work properly.So everything will now depend on the harpoons.
9:05am GMT
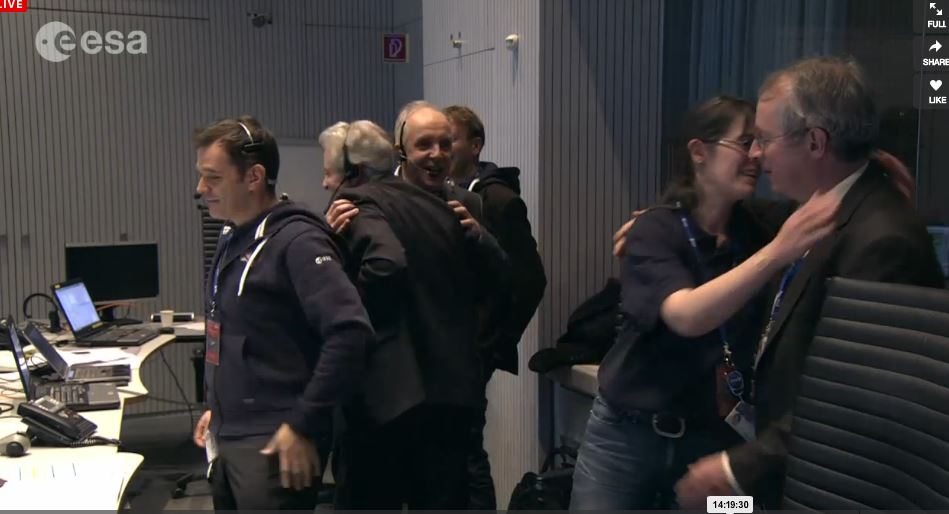
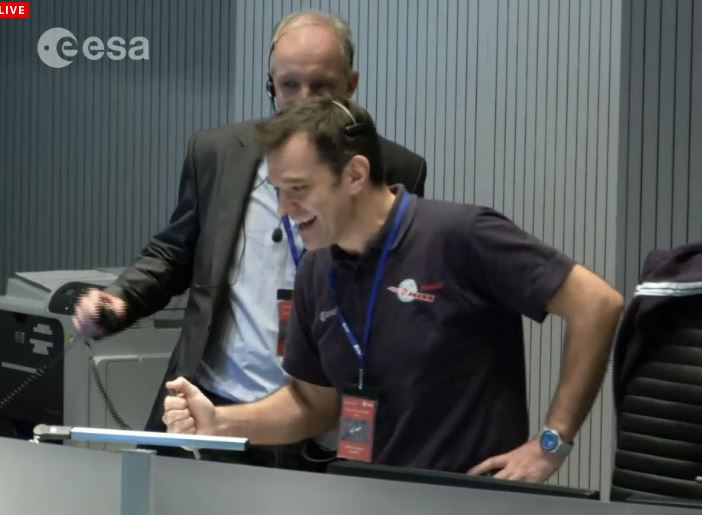
Separation is succesfull!!
Waiting. Tense
Relief. Hugging
From now on, the Philae is on its own. In two hours time hopefully contact will be reestablished between Rosetta and Philae
11:10am GMT
Contact established between Philae and Rosetta! Great! This is a bigger step than the deployment. Philae is too weak to communicate directly with Earth, it has to do that via Rosetta. And it did! So now we can follow its descent to the comet, and it may even be able to send pictures.
Tension and relief again..:-)
2:20pm GMT
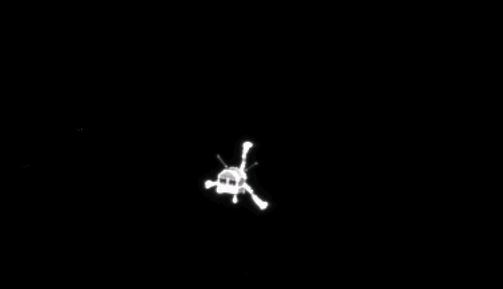
The first image taken by Philae of Rosetta, just a short time after deployment. Unprocessed, so not high quality, but convincing proof that Philae is on its way to 67P
2:40pm GMT
Telemetry data from Philae show that it is following the calculated trajectory accurately. The landing will be the most critical part. Everybody at Esoc keeps his/her fingers crossed.
Here is an image taken by Rosetta’s Osiris camera of the descending Philae lander. Amazing. The landing arms are out.
3:30pm GMT
Waiting now for news about the landing. Personally I do no like the optimistic way of talking about success. There is a reasonable chance of failure, and then the disappointment will be huge.
4:05pm GMT
Success? Or not? It seems Philae has landed. Congratulations
And within minutes the news is spreading all over the world…:-)

UPDATE 14 NOVEMBER
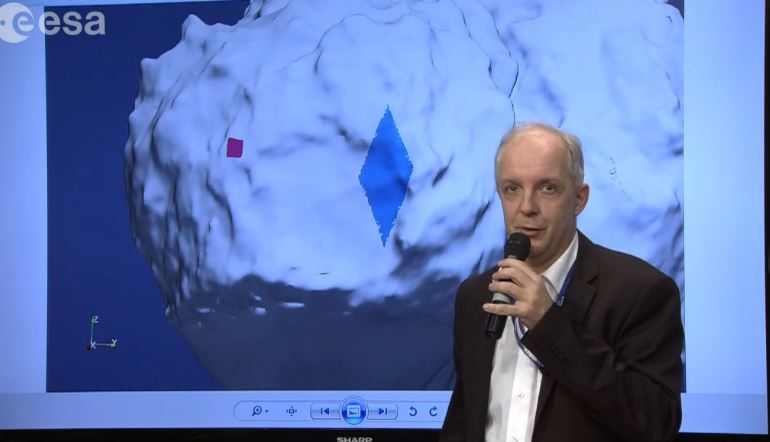
We know now that the Philae has really landed, but not without difficulty! The harpoons meant to anchor the lander, did not fire, so the lander bounced back after touchdown. Because of the low gravity of the comet, it took almost 2 hours before the second touchdown! Then, a few minutes later, the third and final touchdown. The first bounce took the lander up, about 1 km vertically, but also possibly the same distance horizontally. So at the moment the scientists are not sure where actually the Philae landed! During a live broadcast, 13-11, one of the lead scientists explained that the intended landing location was the red square (see below). But after the two bounces, the probable location is now within the blue “lozenge”
Because the Philae is not anchored, some of the planned experiments (like drilling to obtain and analyse some comet material) will be risky, as the lander might loose its balance and topple over.
It seems that the Philae has landed in a location that is more rocky than intended, maybe even beside a cliff. Those rocks may obstruct sunlight from reaching the solar panels of Philae. At the moment Philae is using the energy of its batteries, but soon it will depend on solar energy.
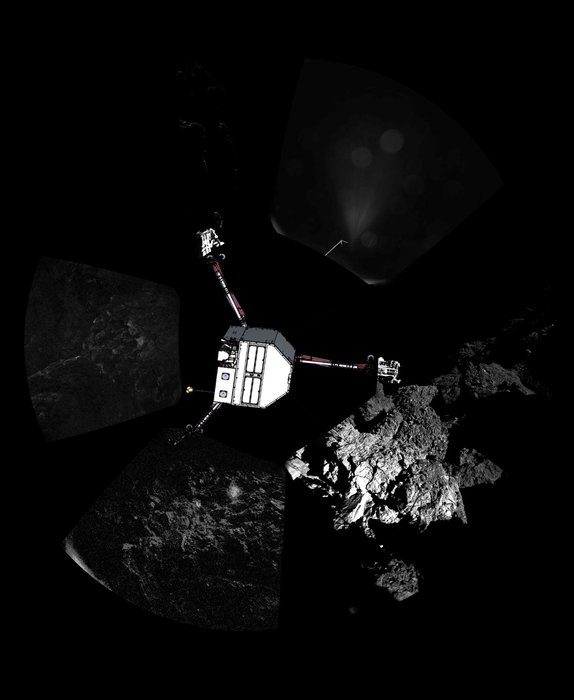
So there are minor(?) problems, which can hopefully be solved. Still the landing is an awesome achievement and at the moment the lander is already collecting scientific data and sending them to Rosetta. Also pictures of the surroundings have been taken. Here are first results, not yet fully processed. To the left a series of six “panoramic” pictures. On some of them a foot of the Philae can be seen. The collage to the right shows the same pictures, but with Philae superimposed.