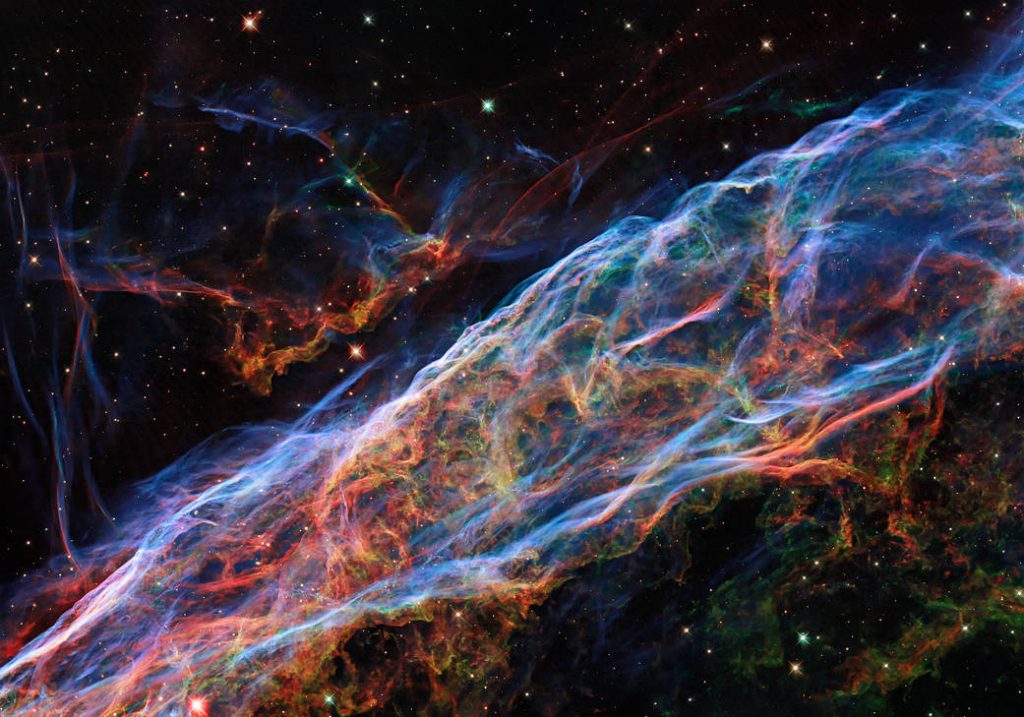
In April the ESA/NASA project published this stunning image as its Picture of the Week. In this blog I will first show some pictures and then give an explanation and some background information.
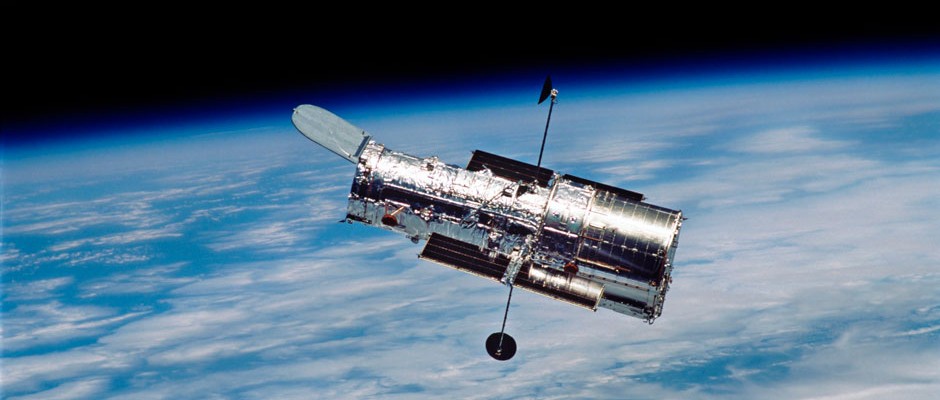
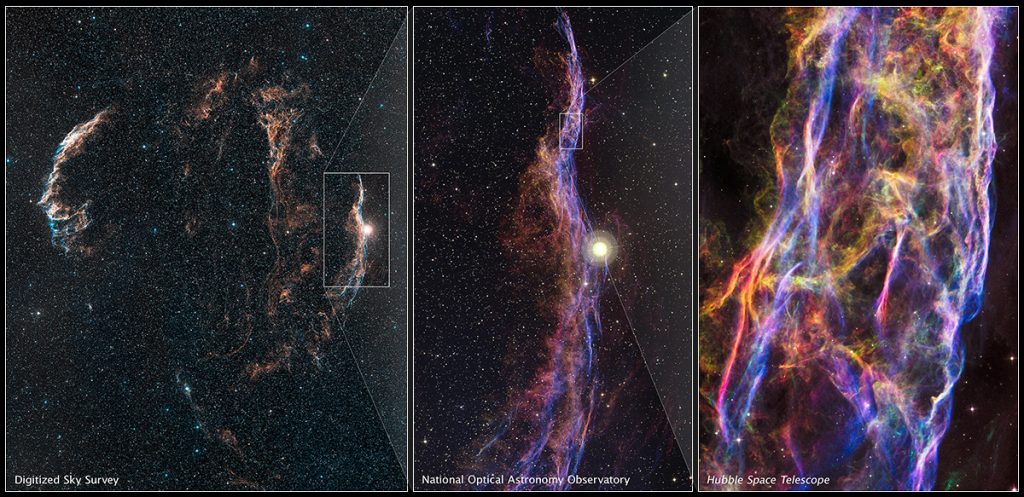
The image was taken by the Wide Field Camera 3 of the Hubble Space Telescope.
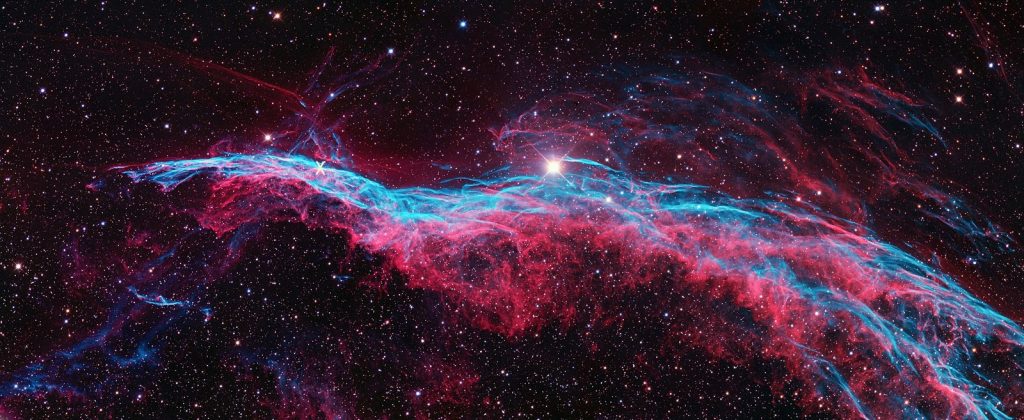
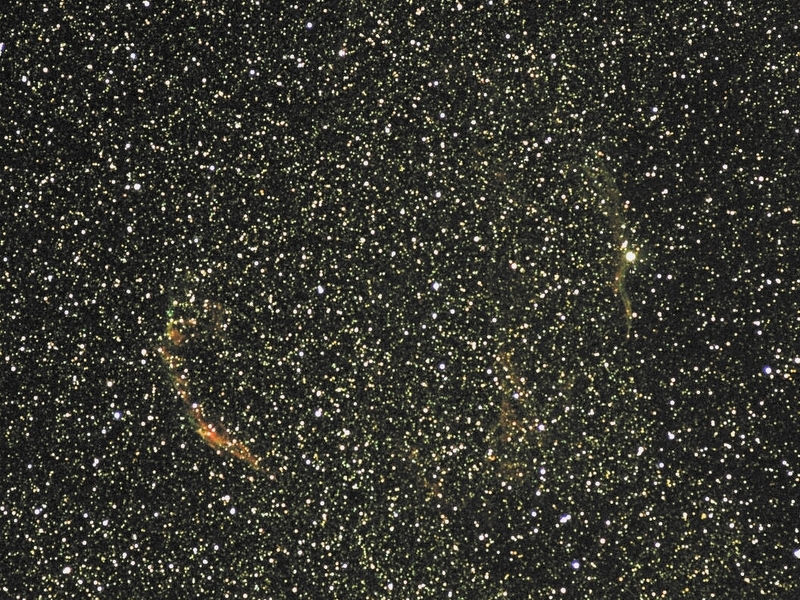
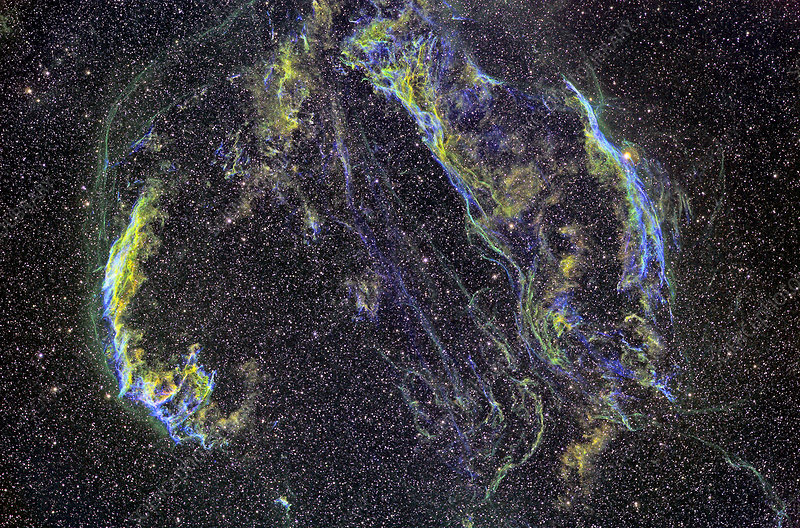
The image shows a very small part of the Witch’s Broom Nebula, also called the Western Veil Nebula. I have marked the (tiny) location of the detailed image with an x (click to enlarge)
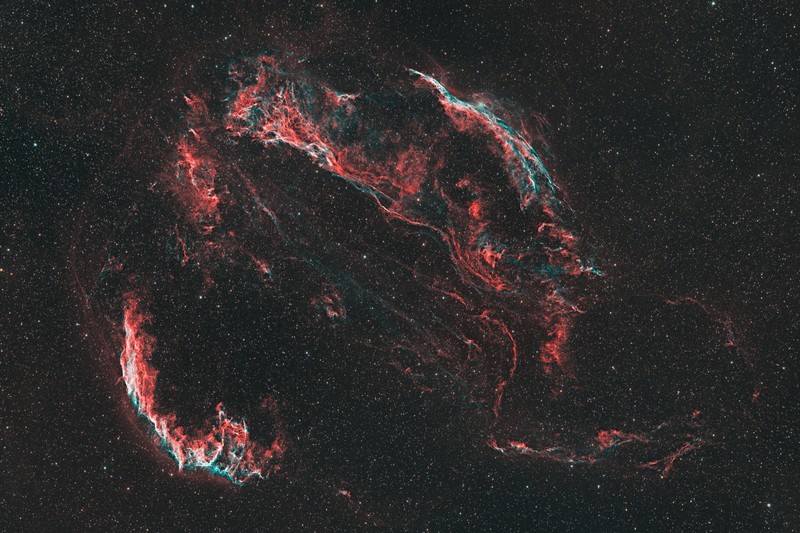
This nebula is in its turn part of the Cygnus Loop. Upper right the Witch’s Broom Nebula, lower left the Eastern Veil Nebula.
Getting confused? Here is the relation between the various images. Left the Cygnus Loop, in the middle the Witch’s Broom and right the detail.
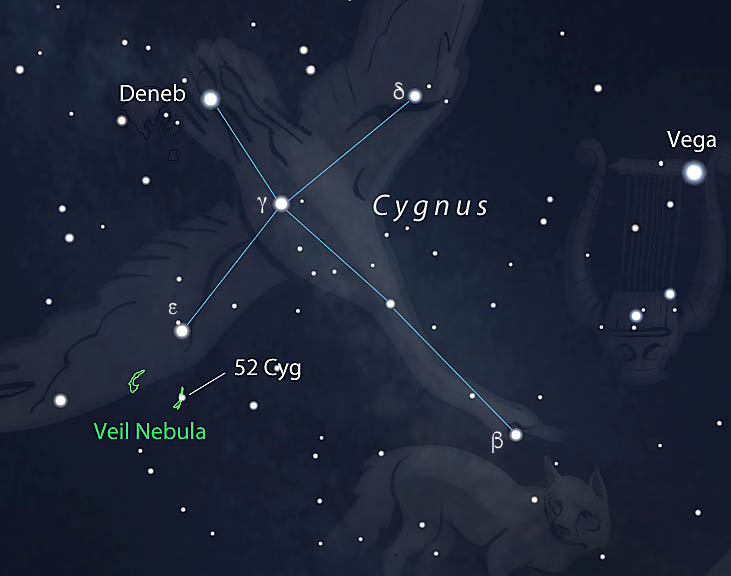
The Cygnus Loop is located in the constellation Cygnus (the Swan). Deneb and Vega are very bright stars. The Cygnus Loop (Veil Nebula) is marked in the lower left
This YouTube video may also help
_______________________
About the Cygnus loop and the Veil Nebula
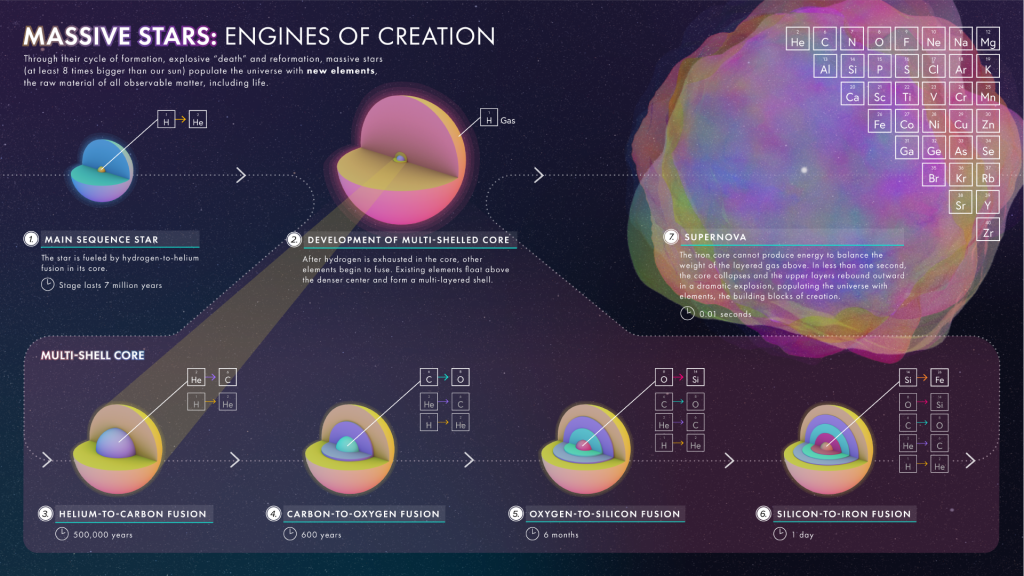
The Cygnus loop and the Veil Nebula are the remnants of a supernova. Many thousands year ago a massive star (much more massive than our Sun) had used up all its “fuel” and exploded in a final spasm before dying. In that explosion, much of the star material is ejected, leaving behind a neutron star or even a black hole. For a short period the star can outshine its whole galaxy!
In this NASA infogram, the development of such a massive star is given. It contains lots of information, but you can skip the details for this blog.
Much research has been done about the Cygnus Loop, the Veil nebula and the star that caused it. The Cygnus Loop is huge, its diameter is about six times the diameter of the moon. You need basically a telescope to see it.
It is a so-called emission nebula. The gas and dust in the nebula is ionised by the shockwave of the exploded star and the light we observe is the light emitted by the atoms in the nebula. The color of the emitted light depends on the kind of element. Very simplified: hydrogen emits reddish light, oxygen bluish light etc. When you look at the image of the Witch’s Broom nebula, you see that it mainly consists of (ionised) hydrogen and oxygen.
Determining the distance of the Cygnus Loop is a complicated process and you will find many values on the Internet. A distance of ~ 2400 lightyear is nowadays accepted by most astronomers. This would give the actual size of the Cygnus Loop as 130 lightyear! The loop is still expanding with a speed of ~ 1.5 million km/h
When did the star explode? Many different estimates. In the release of the first picture above a value of ~10000 year is given ( and a distance of 2100 lightyear). Humans living in that time would have observed the sudden appearance of a very bright “new” star, brighter than Venus and probably even visible in broad daylight. That explains the name (super)nova with nova meaning new in Latin. Supernovae are very rare, the last one in our own Milky Way, visible from Earth, was observed and studied by Kepler in 1604.
Scientists are still searching for a neutron star, or a blackhole in the center of the nebula, but until now nothing has been found.
A lot more can be said about supernovae. In the infogram above they are called “Engines of Creation” and that is an apt description. After the Big Bang the Universe consisted of hydrogen and helium, there was no oxygen no sulfur, no calcium, no iron etc. But Earth and all living creatures are built from those elements. How come? The answer is simple, all those elements have been formed inside stars! We are literally Star Children.
_______________________
About the pictures
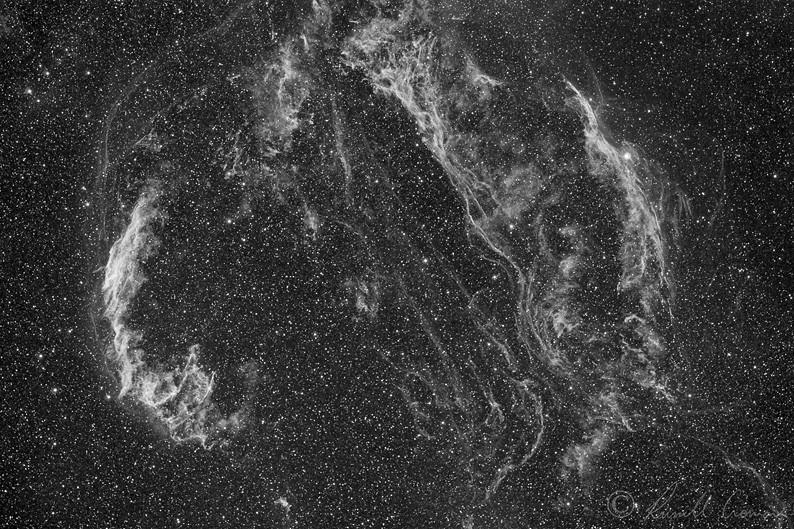
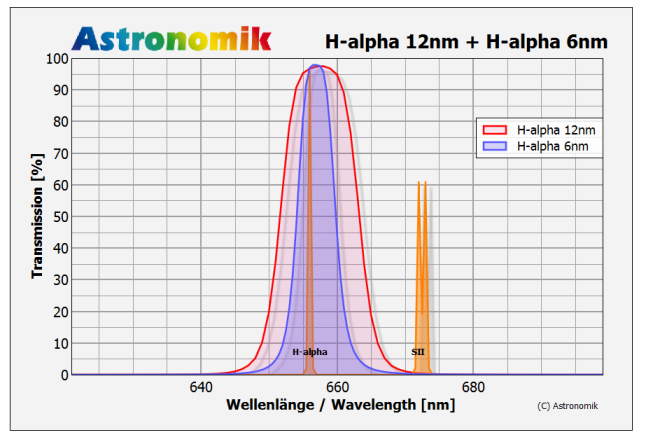
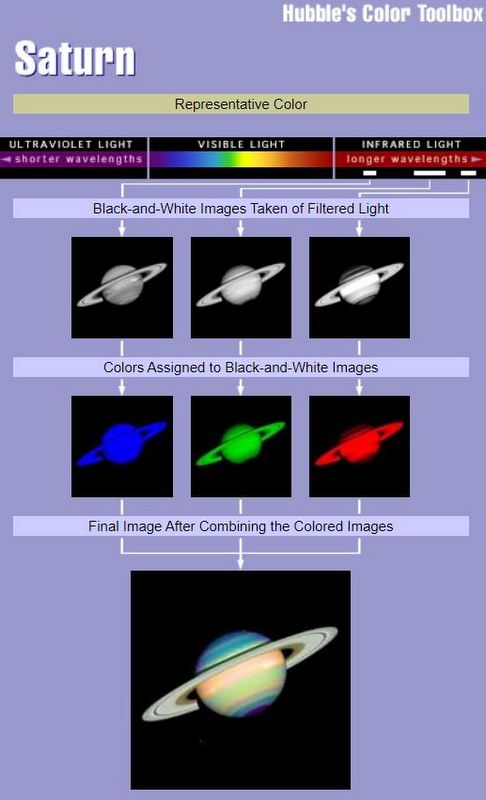
The Wide Field Camera of the Hubble Space Telescope takes colorful pictures. Wrong! It takes black and white pictures as do basically all other telescopes. But it uses a filter to select only a specific color (range). And it takes pictures of the same object using other filters, selecting different colors. For the picture above with the stunning details of the Witch’s Broom five filters were used. And those filters are not just simple pieces of red, green or blue glass. A widely used filter is the H-alpha filter, that only lets through the red light of hydrogen (technically: a wavelength of 656 nm, bandwidth a few nm). Here is a picture of the Cygnus loop, using a H-alpha filter.
Compare it with this photo, taken with a color camera without any filters. Dominated by the numerous stars, the Witch’s Broom nebula is (almost) invisible,
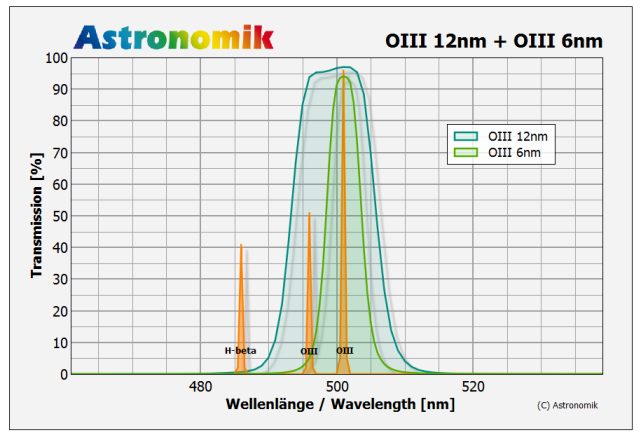
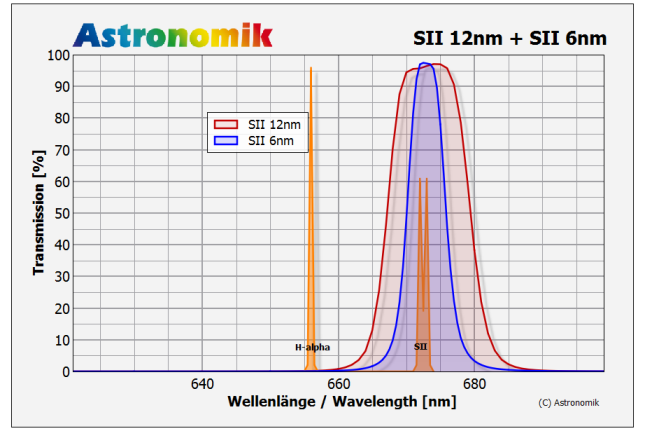
Other popular filters in astrophotography are SII and OIII filters They select the colors of ionised Oxygen blueish and Sulfur (reddish) respectively and block all the other colors.
Combining pictures, taken with different filters, you must assign colors to the black and white images. One option is to choose colors that correspond closely to the color of the filter. In that case the result will look more or less “natural”. The red-blue image of the Cygnus loop is a result of combining the H, O and S filters. But of course you can assign different colors to the B&W pictures. Like in the image below, where hydrogen is green(!), oxygen blue and sulfur red.
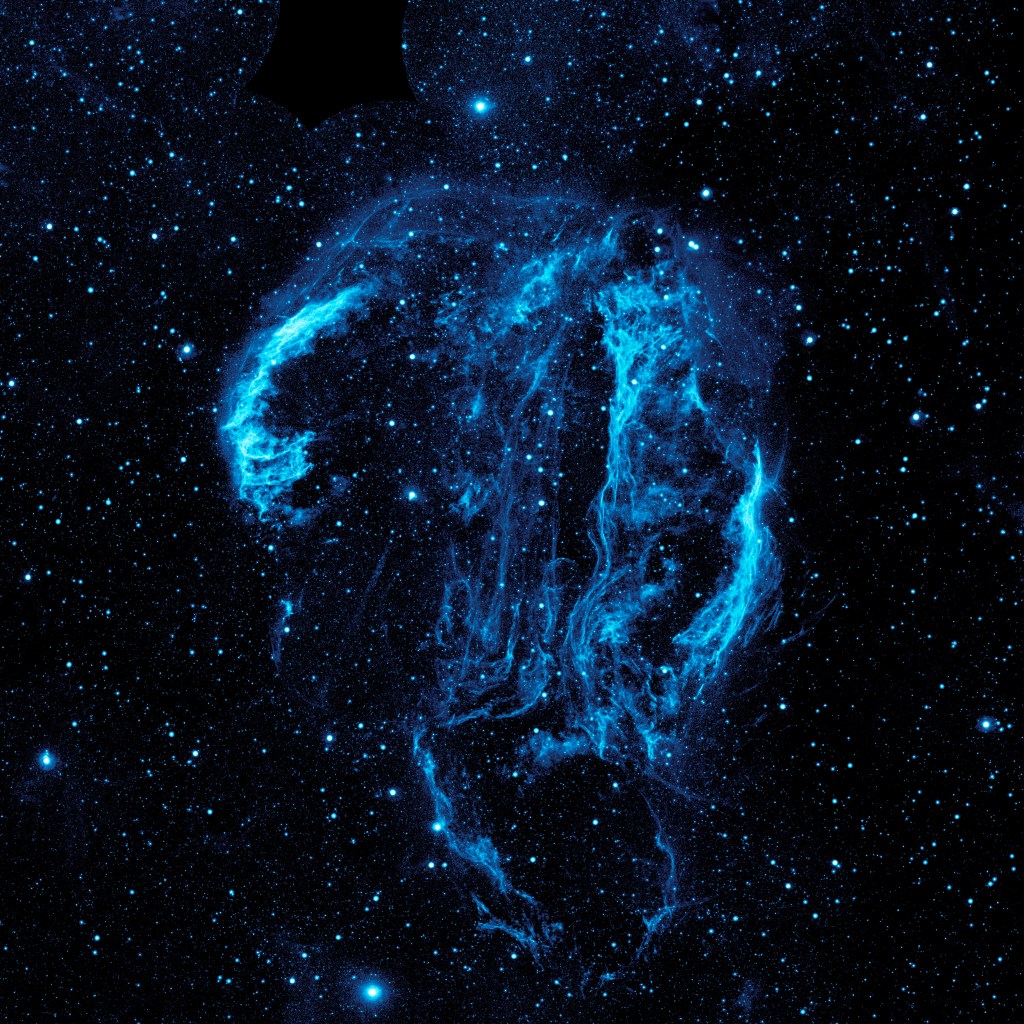
The Hubble Space Telescope can also use infrared or ultraviolet filters. Here is the Cygnus loop in ultraviolet, blue has been assigned to the B&W image.
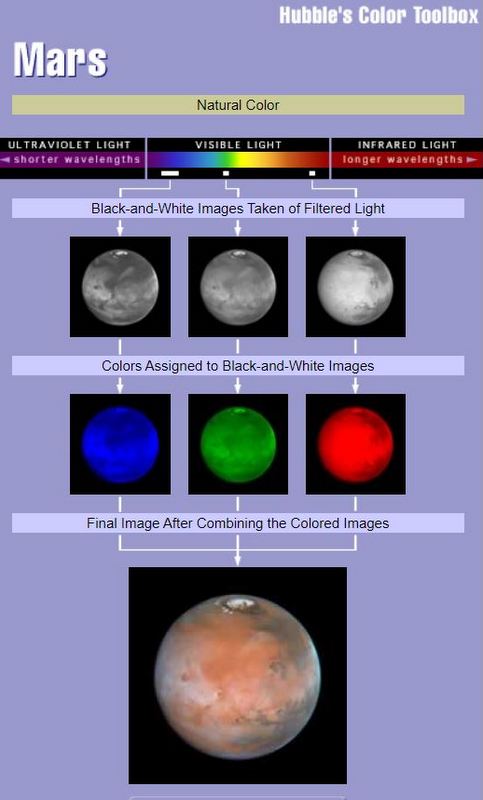
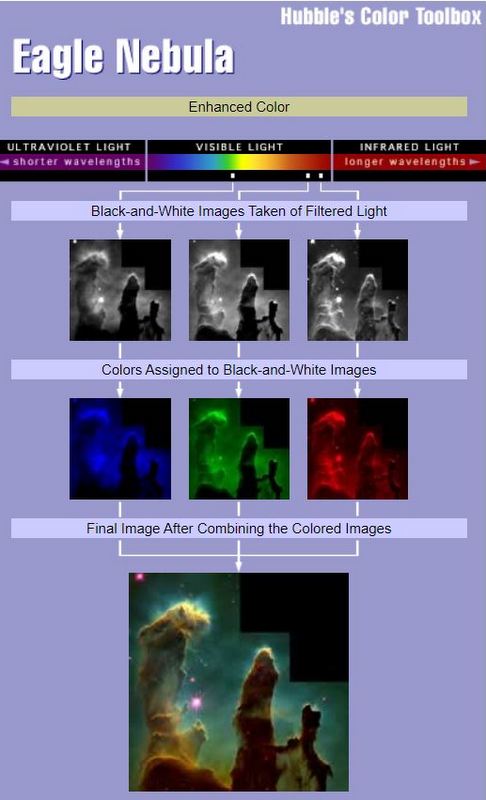
The Hubble website has a very informative section The meaning of color in Hubble Images. It shows how the B&W images can be combined in various ways. Very readable, with examples. Here are three.
Left is Mars, where the three filters have been assigned their “real” color. In the middle the famous “Pillars of Creation”, a star forming region. The red hydrogen is depicted in green, the red sulfur light in red and the green oxygen light in blue. The last example shows Saturn in unusual colors, because the B&W pictures were taken with various infrared filters. Near infrared is shown as blue, the middle range as green and the far infrared as red.
Finally here is again April’s Picture of the Week . The text says that It is a combination of five B&W images, Hydrogen in red, oxygen in blue and sulfur in green. No information about the other two.
Two years ago I have written a post, Hayabusa2 , about a Japanese spacecraft and a few months later an update, Solar System Explorers, in which I mentioned the American spacecraft Osiris-Rex.
The two spacecraft have in common that they have a similar mission: travel to an asteroid, collect some surface material from it and bring that back to Earth. That’s why I have given this post the frivolous title of Dust Grabbers.
When I wrote the two posts, both spacecraft had arrived at their respective destinations, but had not yet collected asteroid material. Now they have, so it is time for an update.
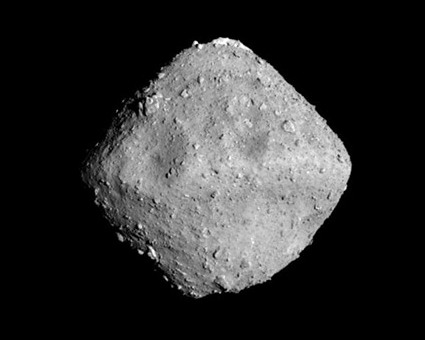
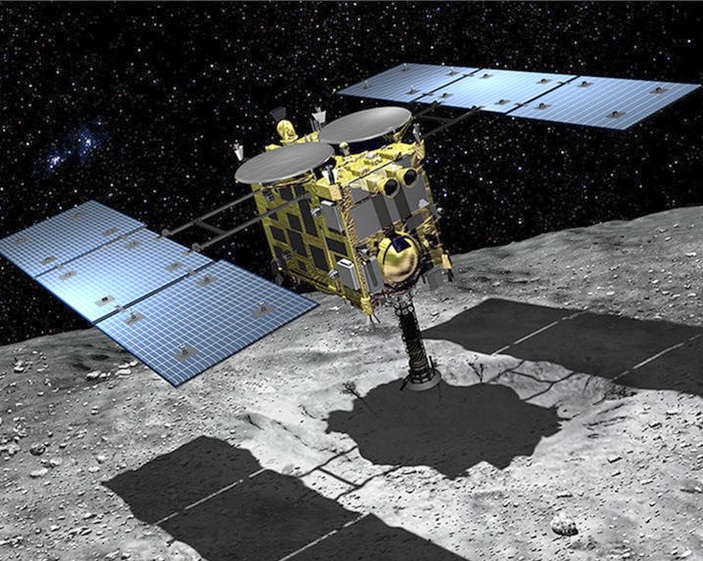
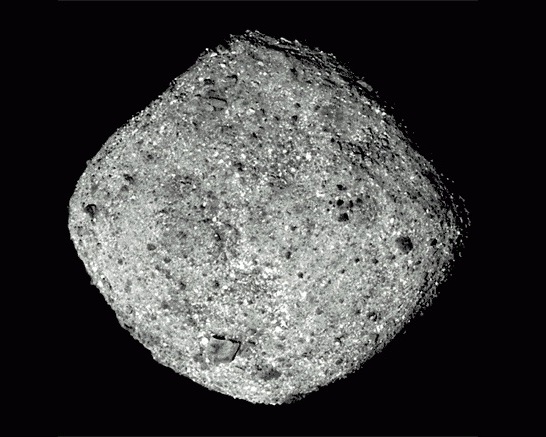
First about Hayabusa2. Here are asteroid Ryugu and the Hayabusa2 spacecraft.
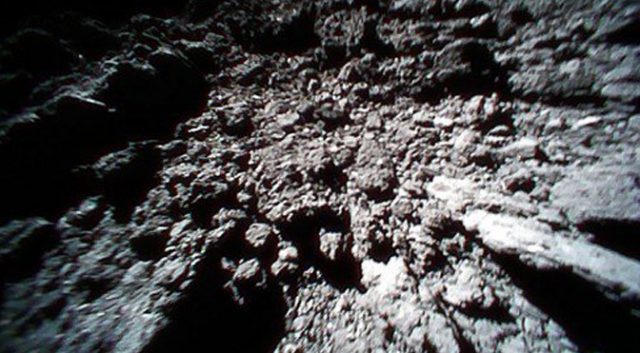
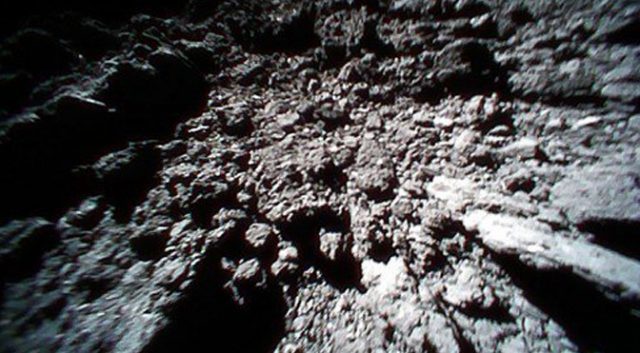
After reaching Ryugu, Hayabusa2 had already successfully dropped two Minerva rovers and the Mascot lander on the surface of the asteroid (see my first report). The surface of the asteroid was much rougher than expected, here is a picture taken by one of the Minerva’s.
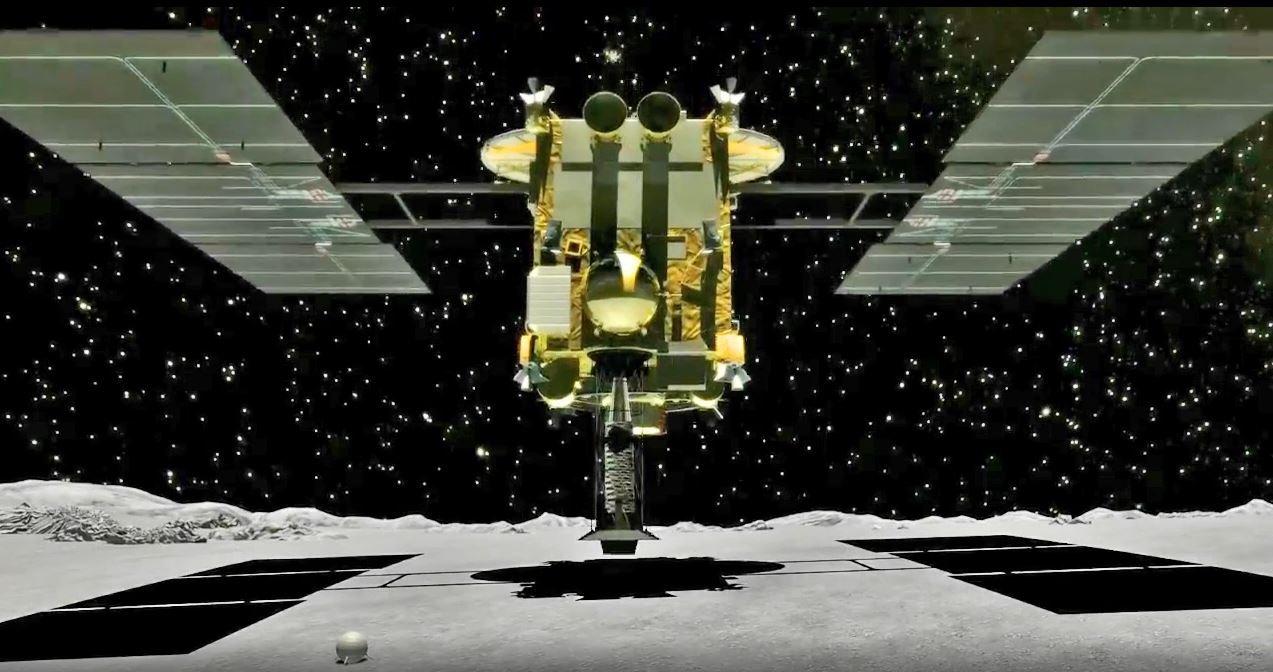
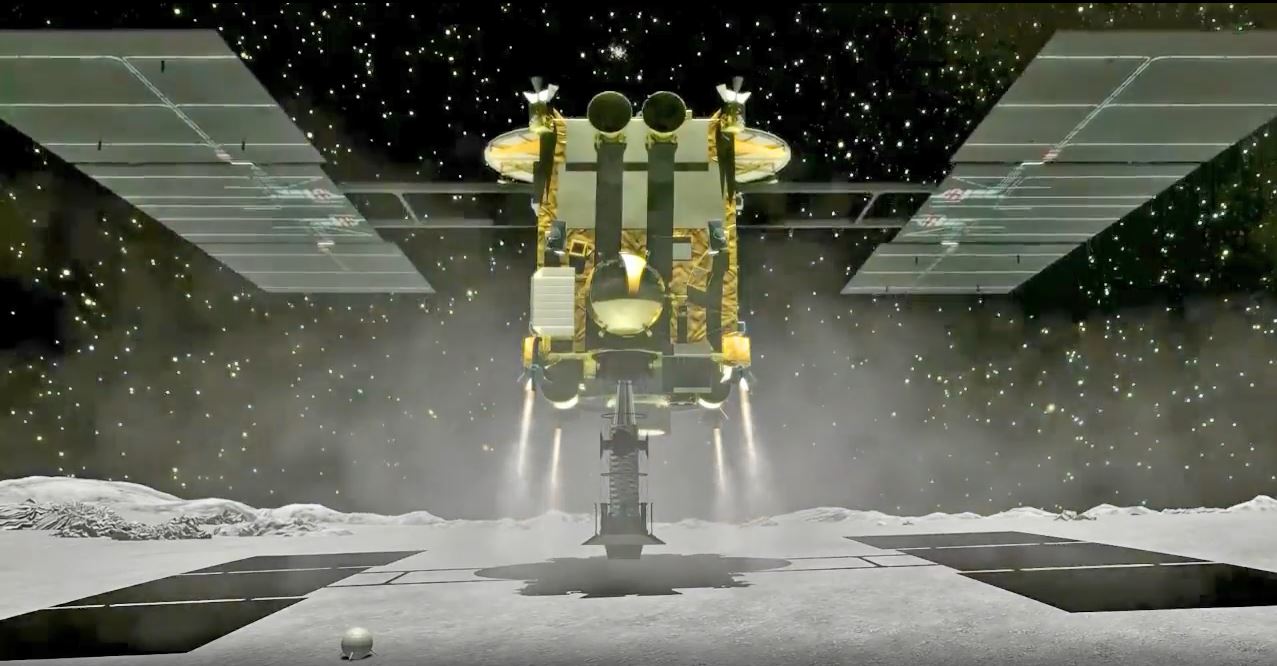
For the touchdown, Hayabusa2 needed a flat surface, without boulders or big rocks and it was difficult to find a suitable location. In my first report I have described the touchdown, here is a very informative animation of the process. Two screenshots, left just before the touchdown, right just after. Notice how flat the asteroid surface is in the animation.
The touchdown was originally planned for October 2018 but postponed, to give the scientists time to redesign the touchdown procedure and check if navigation could be made accurate enough to land in a very small region.
On 6 February JAXA (the Japanese equivalent of NASA) published an extensive pdf-file for the press, Asteroid explorer, Hayabusa2,reporter briefing with a detailed description of the redesigned touchdown. A location had been selected and a target marker (TM) had been dropped near the chosen location. A TM is a small (10 cm) ball of reflecting material, you can see it in the animation screenshots above, left in the foreground.
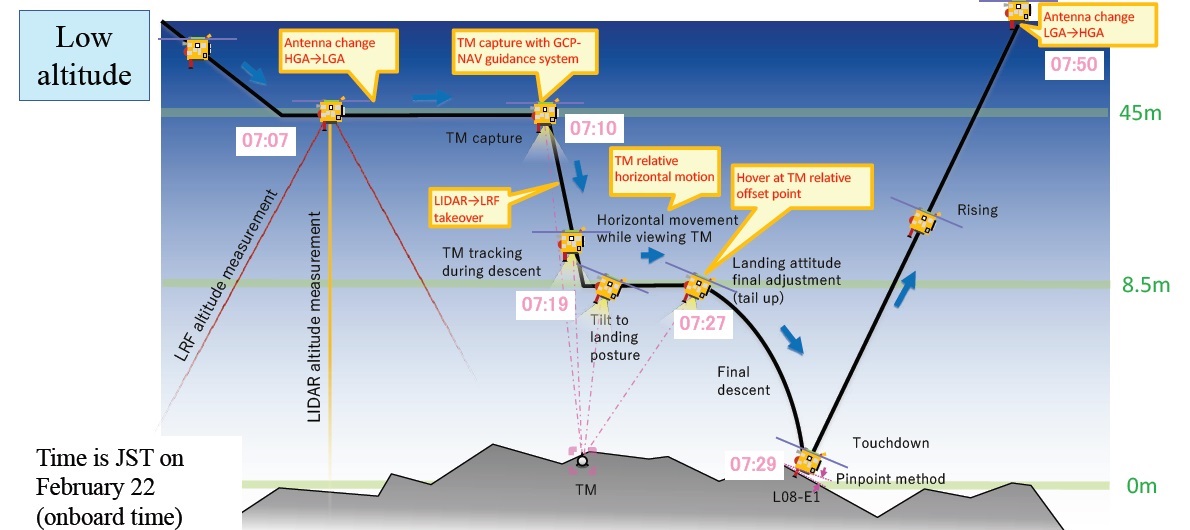
The actual touchdown finally took place on 22 February 2019. One day earlier Hayabusa2 had already descended slowly from its home position (HP) at 20 km altitude to an altitude of 45 m. Here is a time diagram of the touchdown phase. Notice that between 7:07 and 7:50 JST time, there is no communication between the spacecraft and mission control.
Also keep in mind that the touchdown is an autonomous process, because it takes 15 minutes for a signal from Earth to reach the spacecraft. All steps have been programmed by the scientists and engineers.
Try to imagine the tension in Mission Control during this “blackout” period. And the explosion of joy when the first signals from the spacecraft showed that it was still alive.
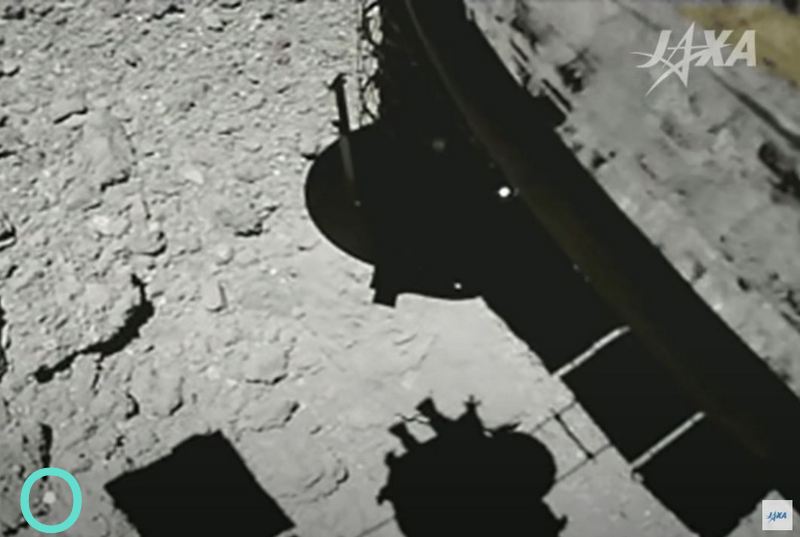
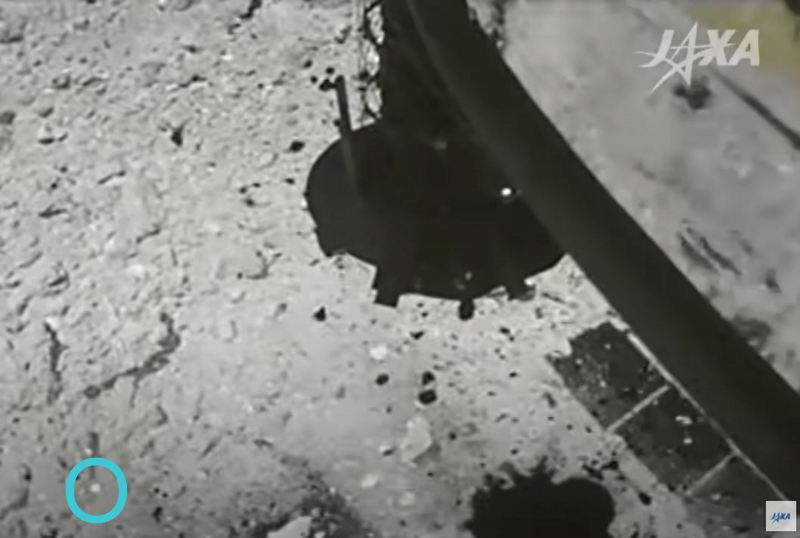
At first this is the only thing they know, that Hayabusa2 is still alive. Only later images and data were coming in. A small video camera was mounted next to the collecting horn and recorded the touchdown. Have a look at the video Here are two screenshots, before and after touchdown. I have indicated the position of the target marker, it is the white stip inside the blue circles. Also notice the surprising amount of rubble whirled up after the touchdown, mostly caused by the thrusters firing.
Originally a second touchdown was planned at a different location, but this was cancelled because of the rugged surface of Ryugu. Instead the scientists concentrated on the most ambitious part of the program. The first touchdown had collected some surface material of the asteroid. Technically called regolith . This material has the same age as the asteroid itself, but has been exposed during millions of years to solar wind and radiation.
Of course it would be very interesting to collect some asteroid material from BELOW the surface. Here is the ingenuous plan developed by the Japanese scientists:
shoot a projectile to Ryugu to create an artificial crater.
touchdown later in the crater to collect some newly exposed material.
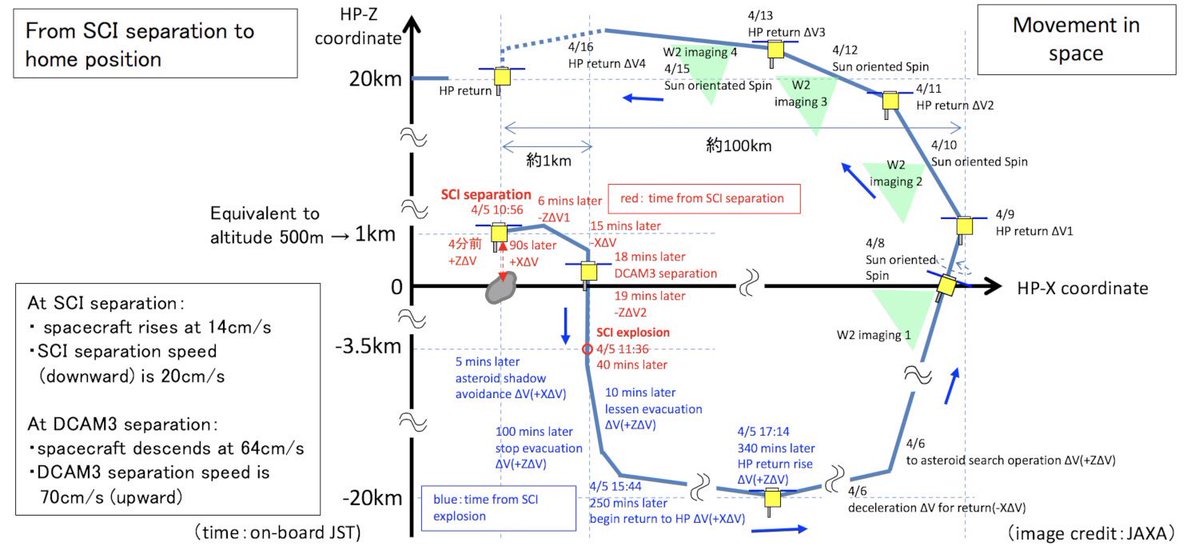
And that’s what they did! I have described the working of the so-called SCI (Small Carry-on Impactor) in my first post. Basically it is a copper projectile (2 kg) that hits the surface of Ryugu with a speed of 2 km/s, creating a crater of several meters diameter. Here is a diagram of the operation. Lots of details, I will point out a few. The operation took place on 5 April 2019.
Hayabusa2 descends from HP to an altitude of 500 m and releases the SCI with a downward speed of 20 cm/s. Here you see a time-lapse of the deployment. It takes about 40 minutes for the SCI to reach the surface and detonate. The detonation will cause a lot of debris, so Hayabusa2 must take shelter and does that by moving horizontally away and then down into the “shadow” of Ryugu.
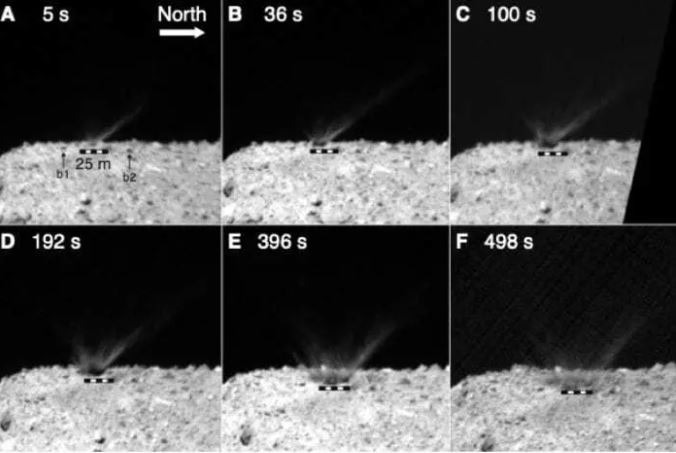
Before disappearing below Ryugu’s horizon Hayabusa2 deployed a camera (DCAM3) to take pictures of the explosion. Here are some images. Not that spectacular for a layman, but apparently the scientists were able to draw conclusions from the vague plumes of debris that are visible.
Because of Ryugu’s weak gravitation it takes days before the debris of the explosion settles down. Notice times and distances in the diagram, Hayabusa2 moves away horizontally for about 100 km before “climbing up” again and finally reaches HP more than 10(!) days after the deployment of the SCI.
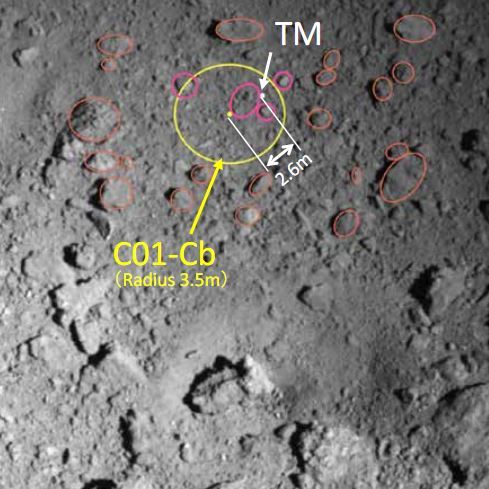
After the successful creation of an artifical crater, Hayabusa2 descended a few times above the crater to explore the new situation. Was it feasible to touchdown in or near the crater to collect material, exposed by the explosion, without jeopardizing the success of the first touchdown? On 8 July Jaxa published a very readable report discussing the pros and cons of a second touchdown: To go or not to go . It was decided to go and have a touchdown in the region C01-Cb, not really inside the crater but on the rim. Here are two images to show the touchdown area. The left image shows the artifical crater at the bottom right, the right image gives details about the size of rocks near the touchdown.
The procedure for the second touchdown was basically the same as for the first one. During one of the descends a target marker was released and on 11 July 2019 the touchdown took place. A sample was collected successfully.
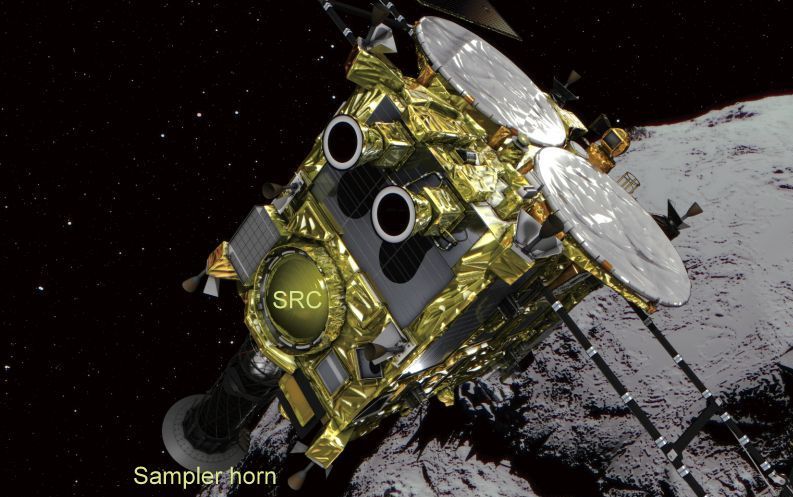
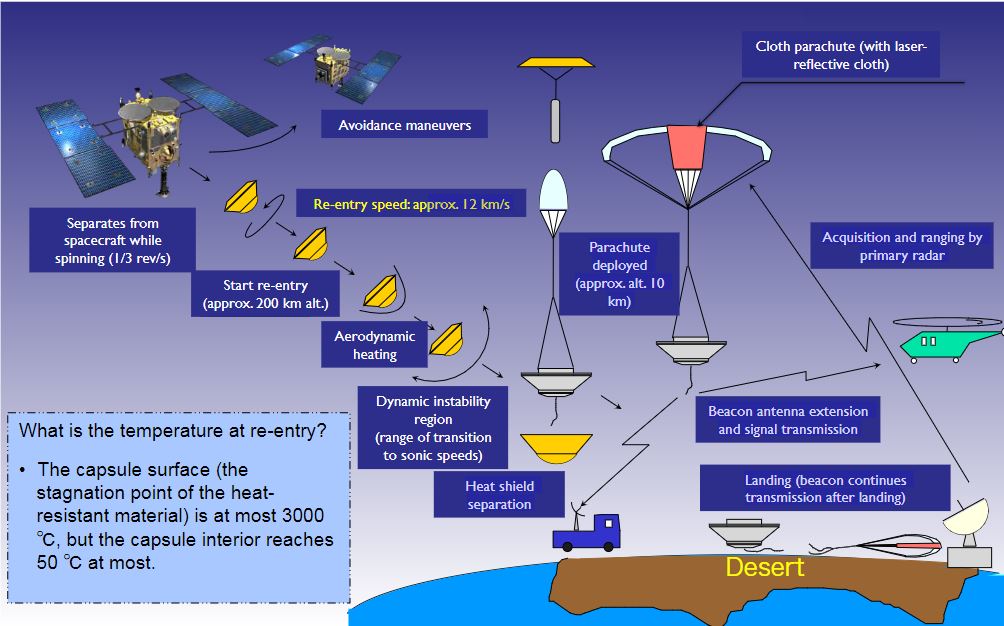
Mission accomplished, time to go home. How to deliver the two samples to Earth? Have another look at the Hayabuss2. I have indicated the Sampler Horn and the SRC, the Sample Return Capsule. In this tiny (40 cm diameter) capsule the two samples have been stored (right diagram) and it is this capsule that will be released when Hayabusa2 arrives back at Earth.
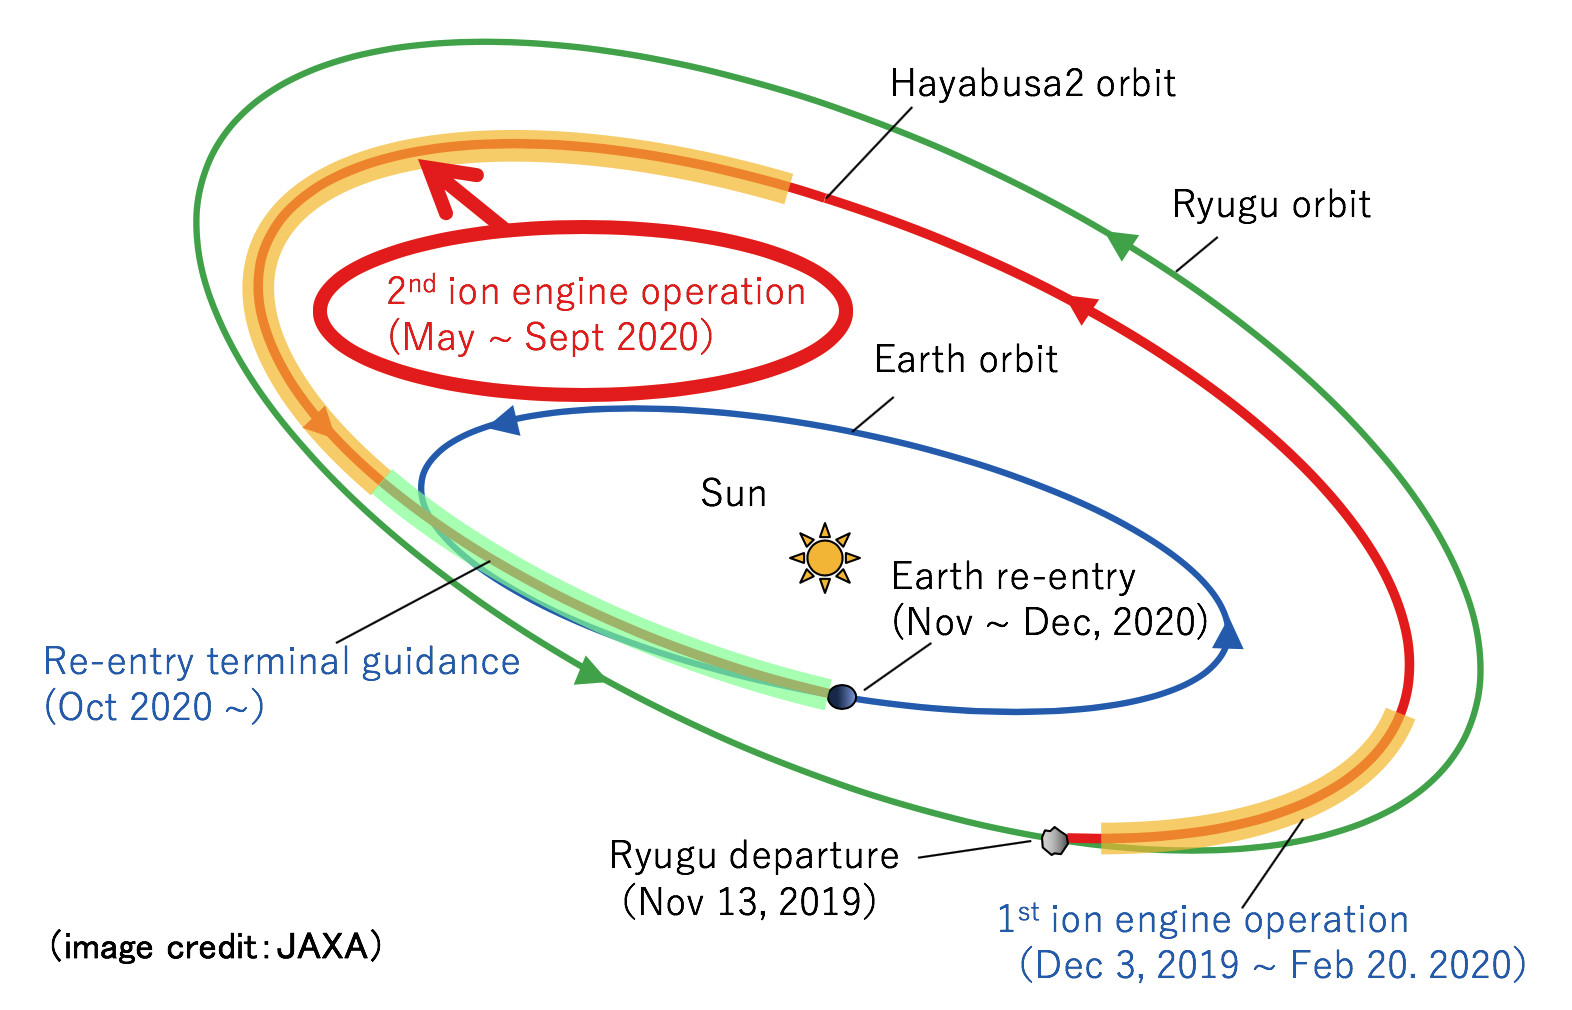
After leaving Ryugu on 13 November 2019,Hayabusa2 l will reach Earth on 6 December 2020, using its ion engines for navigation.
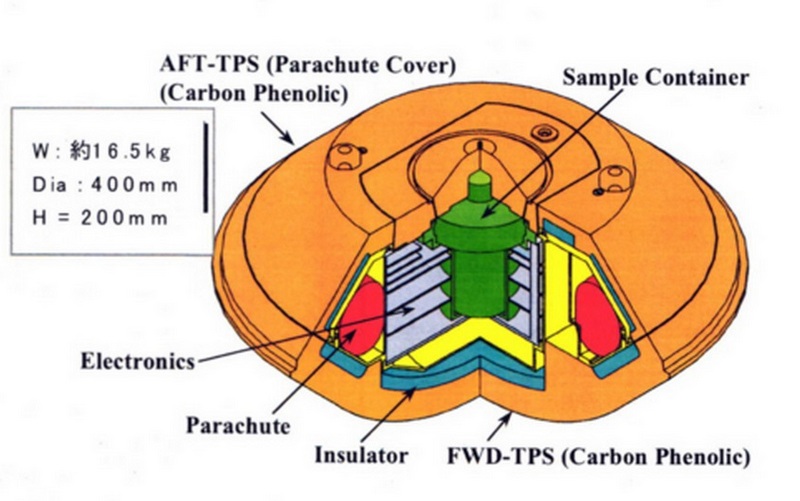
Here is a diagram of the SRC return. The capsule will enter the Earth atmosphere with a speed of 12 km/s, the heat shields will protect the sample container. At 10 km altitude a parachute will be deployed.
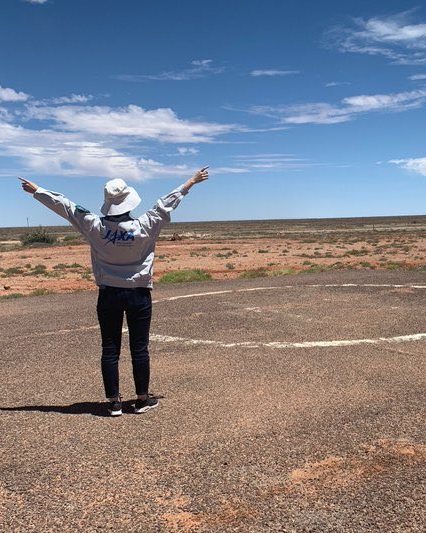
The planned landing location is the Woomera desert in Australia, about 450 km north-west of Adelaide. Expected landing 6 December between 2:47-2:57 JST. It will take time to find the capsule, hopefully within one day. Here is a photo of the Woomera desert.
JAXA is maintaining a monumental website about Hayabusa2, updated with the latest news: JAXA Hayabusa2 Project.
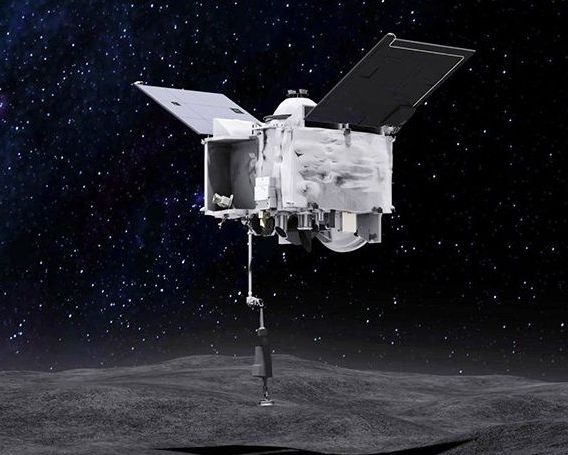
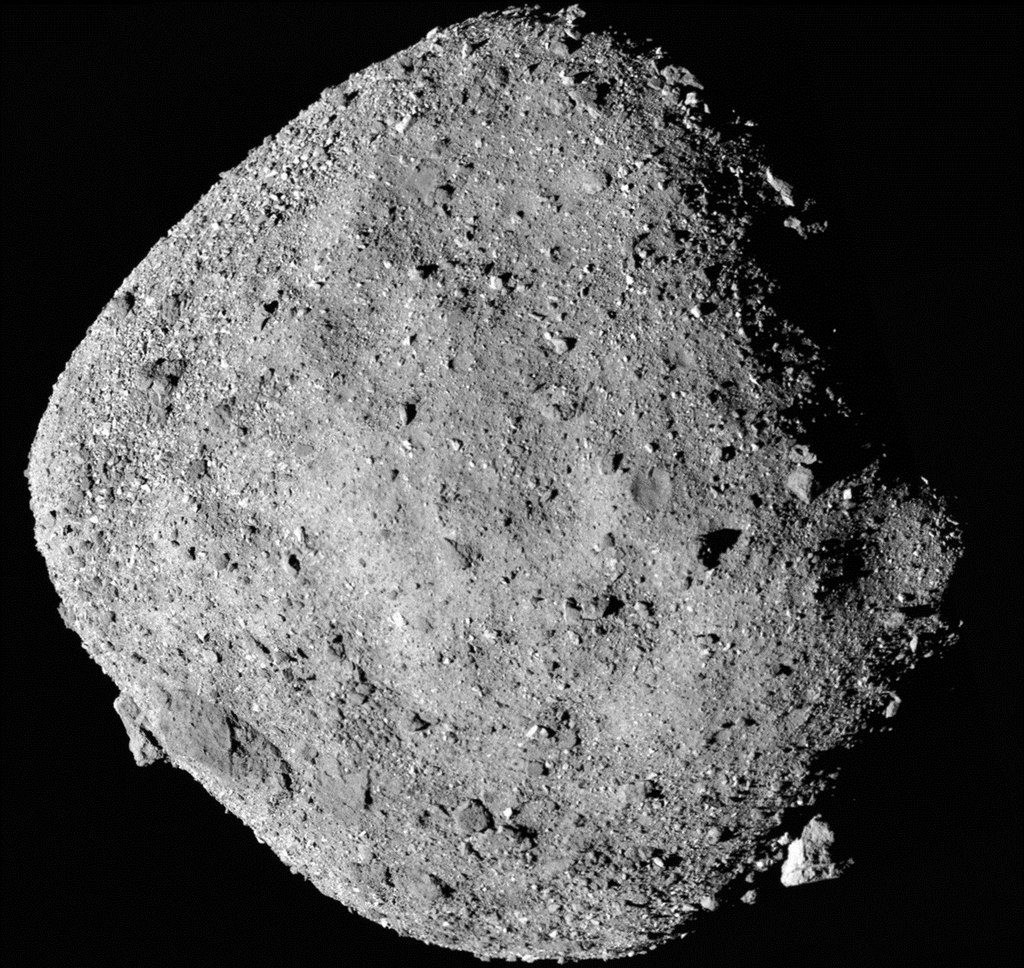
After this long report about Hayabusa2, I will be much shorter about the Osiris Rex mission. Here is asteroid Bennu, smaller (~500 meter) than Ryugu (~ 900 meter). Both asteroids are spinning fast (~ 4 and ~ 8 hours respectively) and that might partly explain their similar shape of a “spinning top”. Although the material of these asteroids is about 4.5 billion years old, both were probably formed after a catastrophic collision of parent asteroids, millions of years ago.
The Osiris Rex spacecraft has a similar design as the Hayabusa2, with a SRC csapsule for the collected asteroid material. But there is one big difference, instead of a sampler horn, the Osiris Rex has a robotic arm, which can be unfolded and grab regolith while the spacecraft is hovering above the surface.
This has its advantages. The Hayabusa2 has to touch the surface (through its horn) and therefore has to worry about rocks nearby. The robotic arm is longer (about 3 meter) and more flexible. Another advantage is the way of collecting regolith. The Hayabusa2 fires a tiny bullet inside the horn and catches the regolith that is swirling upwards. That will not be much, the team is hoping for 1 gram (!) of material. Only after the capsule is opened the mass of the samples can be measured.
The TAGSAM robotic arm of Osiris Rex works very differently. As soon as the sampler touches the surface, nitrogen gas is blown through the arm and regolith will be collected, almost like a vacuum cleaner. Here is a nice animation of the process.
The TAGSAM procedure took place on 20 October 2020 and was very successful, it is estimated that about 60 gram was collected. (For physicists: how can they know that now already? By using a clever trick, rotating the spacecraft and unfolded robotic arm before and after collection, a difference in the moment of inertia will be observed)
The spacecraft will leave Bennu next year and will return to Earth on 24 September 2023, deploying the SRC capsule to land in the Utah desert.
These has been close cooperation between JAXA and NASA. They will share a percentage of the collected material with each other.
TRIVIA:
Brian May, the lead guitarist of Queen, is also an astrophysicist and quite interested in the Hayabusa2 project. During a Queen tour in Japan in January 2020, he met a few project people: Meeting Brian May.
Because of the Covid19 pandemic, the Japanese Sample Collection Team had to arrive early in Australia (with special permission) and first go into 14 days compulsory quarantine . Here a team member is standing at the heliport where the search for the capsule will start.
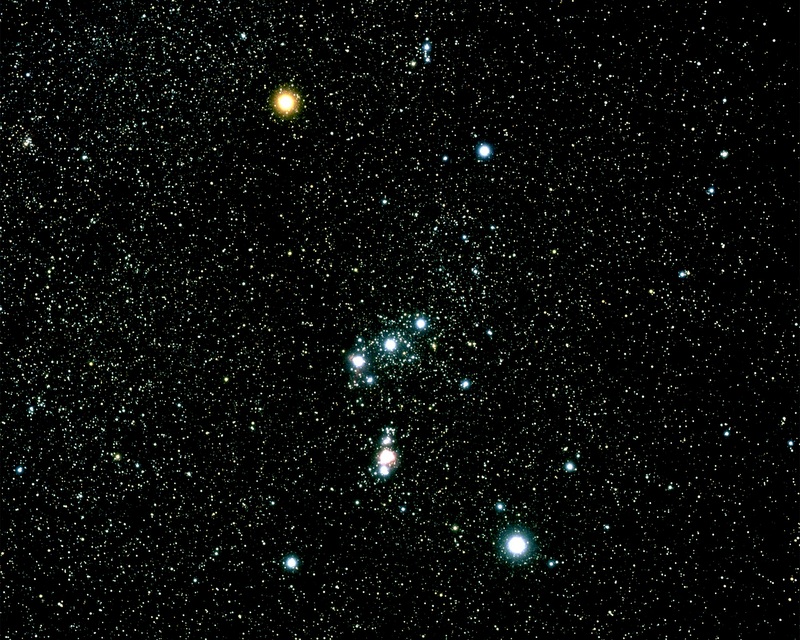
Most of you will know the constellation of Orion. Here is an image taken by the Hubble Space Telescope. The bright reddish star, forming the left shoulder of the Hunter, is called Betelgeuse. Recently this star has been in the news, because there were indications that it might explode in the (near) future.
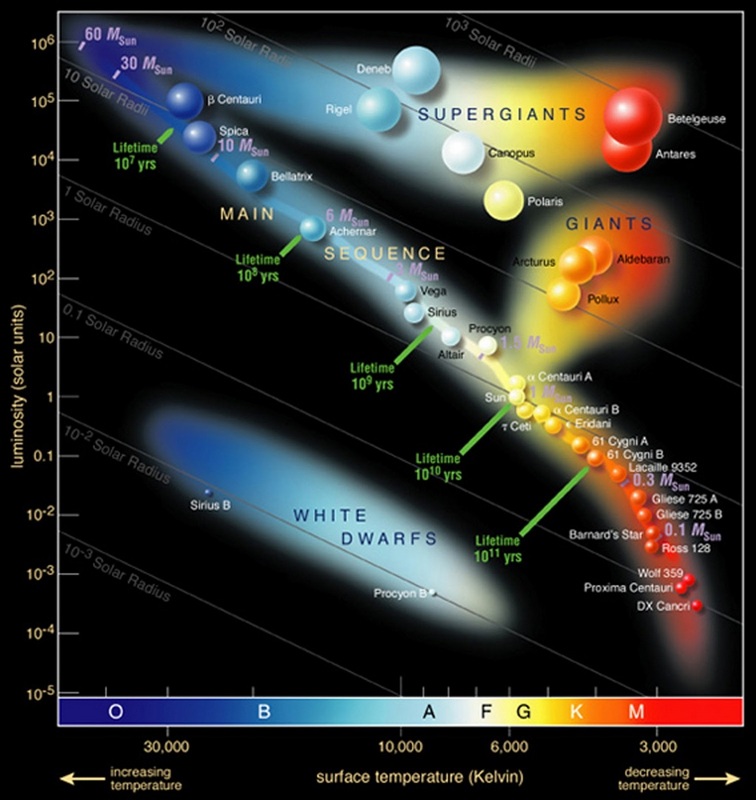
With the present level of light pollution, it is often difficult to observe the colors of stars, and you will see only the brightest. Of course a star closer to the Sun will look brighter than a star many hundreds of lightyears away. Taking the distance into account, astronomers can determine the intrinsic brightness of a star, called the luminosity. When you plot the luminosity of stars against their color, you get the diagram below. It’s called the Hertzsprung–Russell diagram, named after the two astronomers who created it around 1910.
As you see, the diagram has a lot of structure and it has helped astronomers a lot to understand how stars evolve. The vertical axis gives the luminosity, in units of the Solar luminosity, while the horizontal axis gives the surface temperature of the star, which is directly related to its color. Notice that the temperature decreases from left to right.
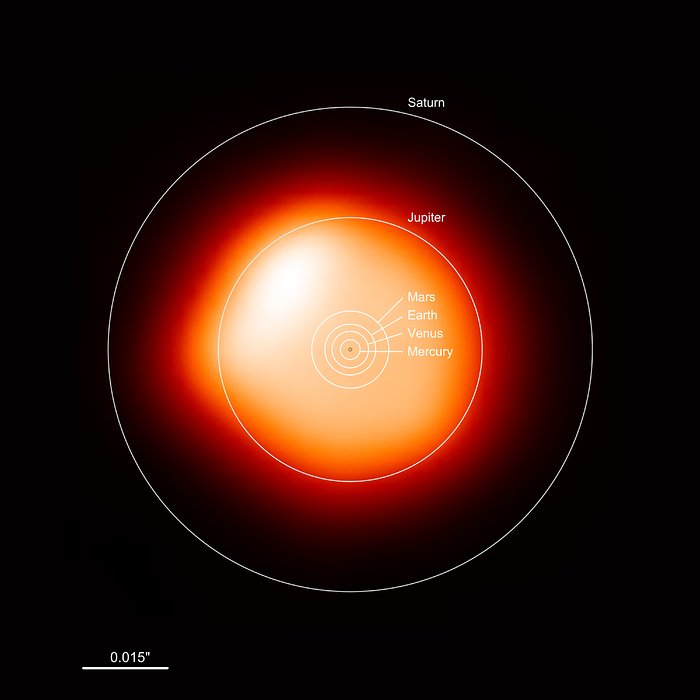
The position of some well-known stars is indicated. Of course our Sun, a yellowish star. Betelgeuse can be found in the upper right corner. it has a luminosity of ~ 100.000 times the Sun ! It is a so-called Red Supergiant Star. A giant star, it’s size is about 900 times the size of the Sun. If it would replace the Sun, we would be swallowed, it would extend to the orbit of Jupiter. The reddish color means that its surface temperature is about 3000K
There are also Blue Supergiant Stars. An example is Rigel, also in Orion (his right leg) with a surface temperature of 11000 K. And there exist White Dwarf Stars, with a size 0.1-0.01 times the Sun, and Giant Stars.
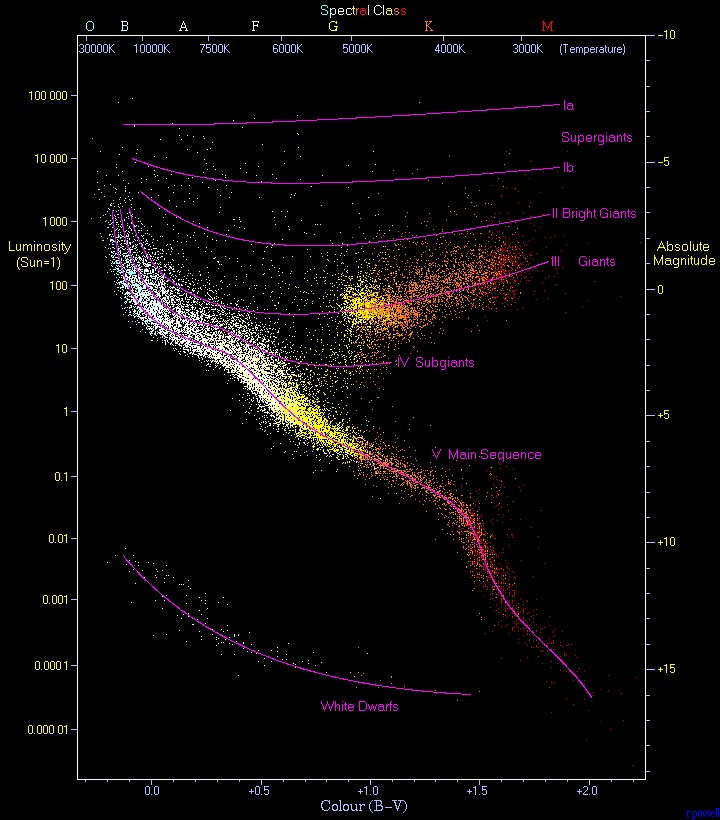
Along the diagonal in the HR diagram you will find the Main Sequence Stars. Most stars are located in this band. Here is a plot of 23000 individual stars in the HR diagram
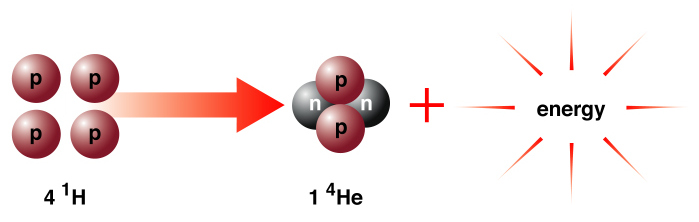
To understand what will happen in the (near) future to Betelgeuse, I must explain a bit about how stars are formed and how they evolve. Stars are born when clouds of interstellar matter (mainly hydrogen and helium) contract as a result of their own gravity. This contraction increases the temperature in the interior of the cloud until the core becomes so hot ( about 15 million Kelvin) that fusion of hydrogen becomes possible. The energy and radiation from this fusion stops the gravitational contraction, a star is born! Here is a very simplified picture of the fusion process.
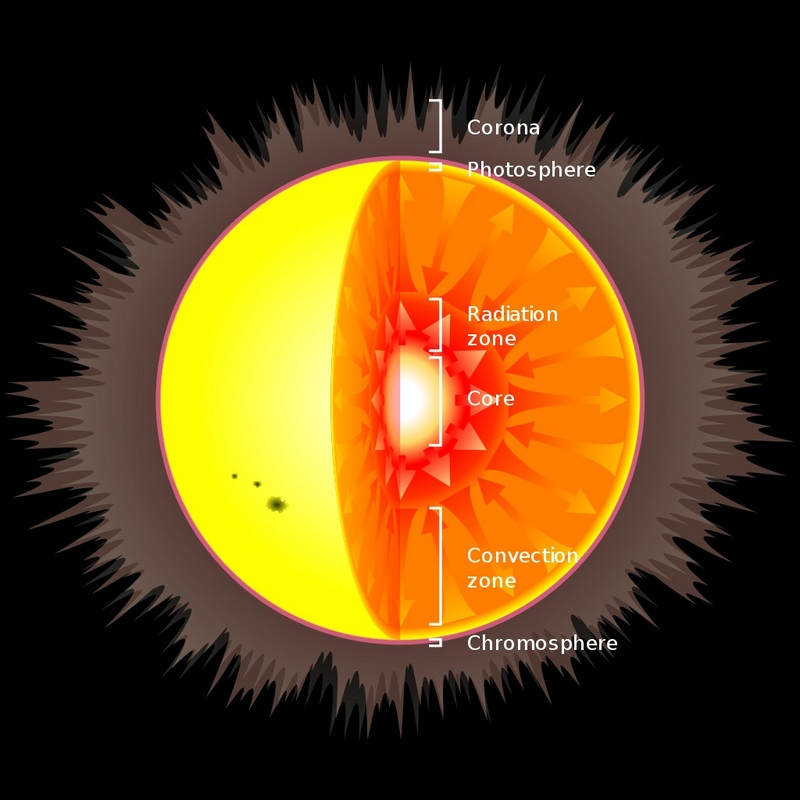
Let’s look at the star nearest to us, our Sun, It was born about 4.6 billion years ago, and its total lifetime is estimated to be around 10 billion year, so at the moment it is about halfway its life. Here is a sketch, the fusion takes place in the core, the radiation is transported to the surface (photosphere), resulting for the Sun in a surface temperature of about 5800 K and an orange color.
For a heavier star than the Sun, the inward pressure due to its gravity is stronger, so the counter pressure of the fusion in the core must also be stronger to create a balance. Here are some of the effects:
The star is bigger and brighter
Its core temperature is higher, the “burning” of hydrogen faster
The surface temperature is higher, the color more blueish/whitish
The lifetime of the star will be shorter
Here is an example: Sirius, the brightest star in the sky. Its mass is two times the mass of the Sun. Compared to the Sun, its radius is 1.7 times larger, its luminosity 25 times larger, its surface temperature is almost 10.000 Kelvin and its lifetime is only about 240 million years. Heavier stars will live even shorter.
We can now explain the Main Sequence in the HR diagram. It is the location of all “normal” stars, who are burning hydrogen in their core. At the lower right we find the low-mass stars, sometimes called red dwarfs , who burn their hydrogen so slowly that their lifetime is many hundred billions of years, longer than the current age of the Universe! At the top left, high-mass stars burn their hydrogen so fast, that in spite of their large mass they have lifetimes of only a few million(!) years.
What happens after the hydrogen fuel in the stellar core is exhausted? That depends on the mass of the star. We will concentrate in this post on the high mass stars (more than 8-10 solar masses), because Betelgeuse is one of them.
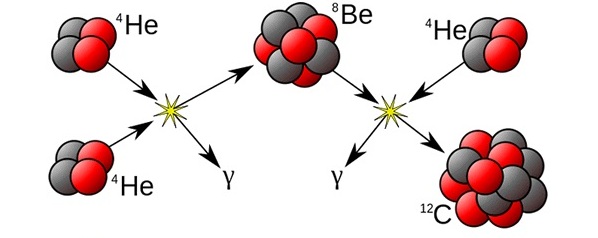
In these massive stars, after all hydrogen in the core has been fused into helium, gravitation will contract the core further, raising its temperature, until helium starts fusing into carbon. At the same time the outer layers of the star expand dramatically, while cooling. The star enters its (red) supergiant phase.
The triple-alpha process, as it is called, generates less energy than the hydrogen fusion. Three helium nuclei fuse into on carbon nucleus. Another simplified image.
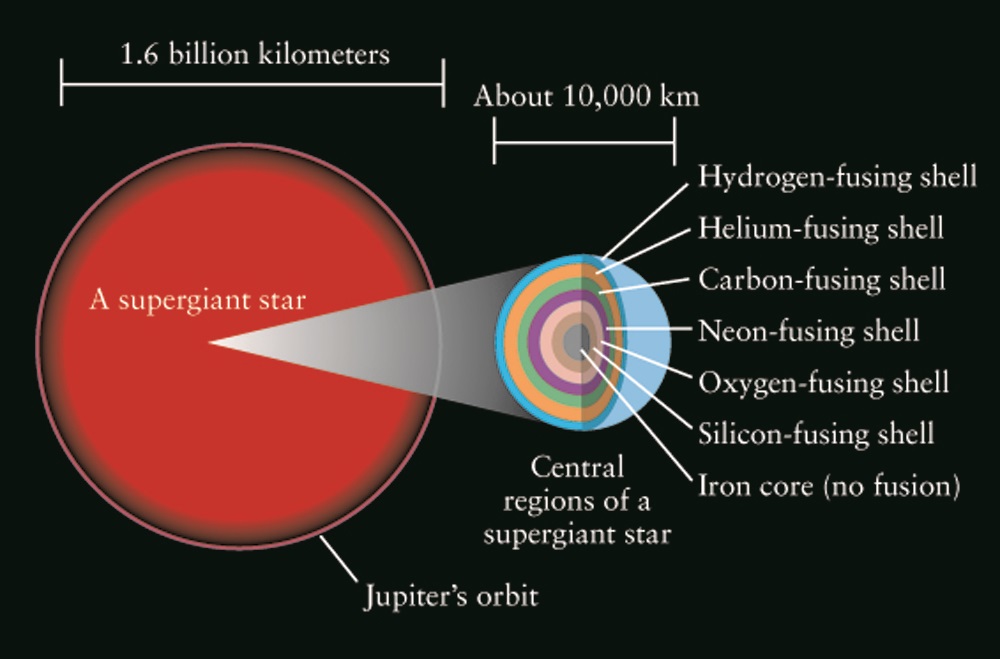
When the core has fused into carbon, the process repeats. Gravitation contracts the core, its temperature increases , and another fusion process starts, leading to a neon core. Next an oxygen core, a silicon core and finally an iron core. Here is a sketch. A few comments. Notice the difference in scale. The outer layers of the red giant extend to the orbit of Jupiter, whereas the core has about the size of Earth! As you see, the central core is surrounded by layers of lower temperature where still fusion of hydrogen helium, etcetera is going on. It’s like the layers of an onion.
The red supergiant phase doesn’t last long, astronomically speaking, the energy of these fusion processes is much less than the hydrogen fusion. Here is an estimate of the time spent in each of the phases for a star of 25 solar masses. Notice the columns for temperature and density.
When the core has become iron , no more energy can be obtained from fusion and the end of the star is near. Gravity will finally win, the core implodes into a neutron star or a black hole while the outer layers are blown away in a cataclysmic explosion. It is called a (Type II) supernova. During a couple of weeks, the supernova may outshine the galaxy it belongs to and release more energy than the Sun during its whole lifetime. If the supernova is not too far away from us, it may become the brightest star in the sky, even visible during daylight. It looks like a new star (nova = new in Latin), but actually we are watching the last throes of a dying star.
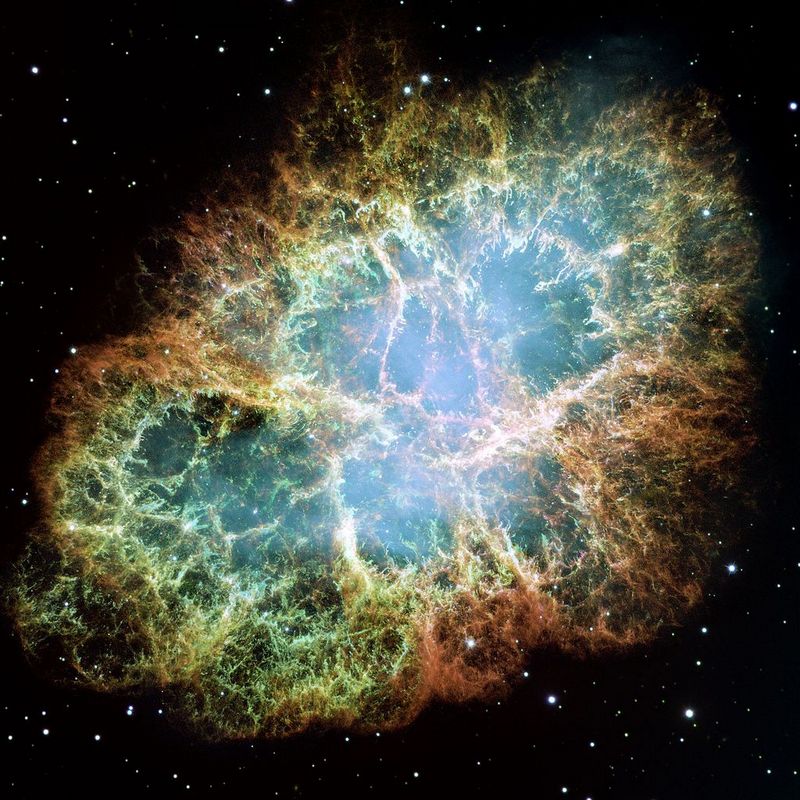
Supernovas are extremely rare, they occur about once every 50 years in a galaxy the size of the Milky Way. A few have been recorded in human history, nowadays many more have been observed in other galaxies. In 1054, Chinese astronomers observed a new star, so bright that during a few weeks it was visible during daylight. Their accurate description made it possible for modern astronomers to conclude that it was a supernova (SN1054) and to identify the Crab Nebula as the remnant of this supernova. Here is the Crab Nebula. At its center a neutron star has been found, the Crab Pulsar.
Click here for a list of supernovae that are of historical significance. The most recent one in our own Milky Way galaxy was Kepler’s Star, observed in 1604, more than 400 years ago!
Time to go back to Betelgeuse. As mentioned in the beginning of this post, it is a red supergiant star at a distance of about 640 lightyear from us. Its mass is about 12 solar masses and its estimated lifetime about 8 million year. It has fused all the hydrogen in its core and is now burning helium in its core. Here is a computer animation of how Betelgeuse might look like.
The gigantic (convection) bubbles are characteristics for this kind of stars. Our Sun has them too, but on a much smaller scale.
Betelgeuse is a variable star, it changes its brightness in a rather irregular way. Here is a graph showing the brightness of Betelgeuse between 1990 and now..
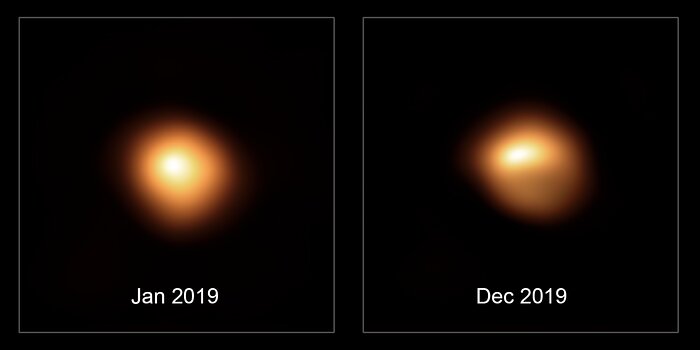
From the right part of this graph you may understand why first astronomers and later the media and the general public became so excited about Betelgeuse. Starting October 2019, the star began to fade more than usual, and by the end of January 2020 it had dropped almost a factor 3 in brightness. A very noticeable difference, here are two photos.
Could it be that this dimming was a signal that Betelgeuse was on its way to become a supernova? It would be a spectacular event, the star might become as bright as the moon and be visible in daylight for many weeks. A harmless event too, the distance of 640 lightyear is too far away. By the way, light from Betelgeuse takes 640 year to reach us, so it could have been exploded already, without us knowing it yet 😉 .
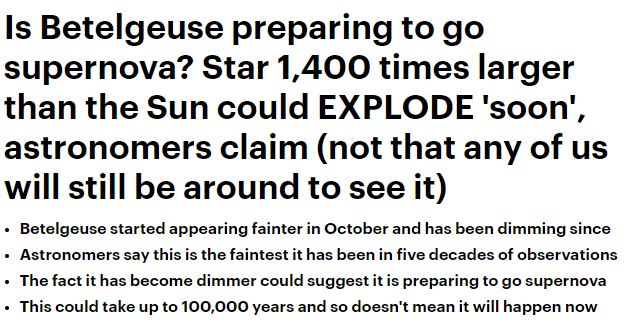
Here is an example of a newspaper headline, in this case the Daily Mail , 23 December last year.
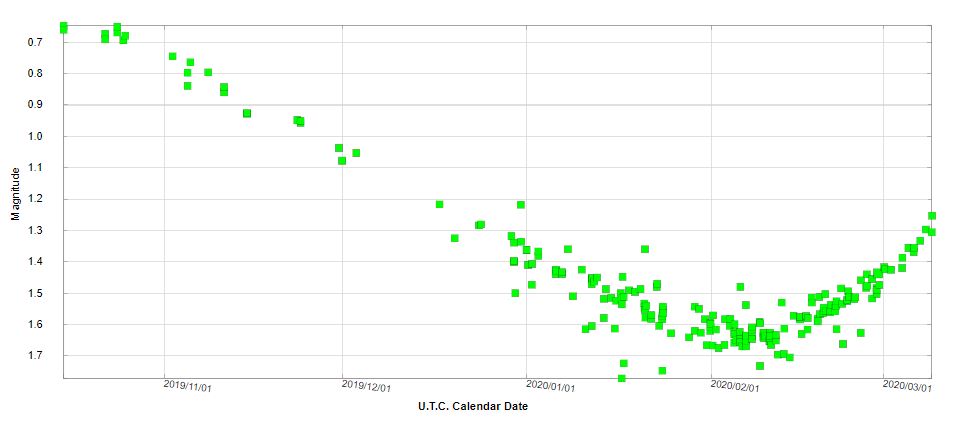
Not surprisingly observers from all over the world have been looking at Betelgeuse the last few months, as you can see in the graph below, notice the density of observations in the last three months :-).
I am sure it must have been a disappointment for many that the last month, the fading stopped and Betelgeuse started to become brighter again.
The last few weeks scientific papers are appearing with possible explanations for the unusual dimming. Probably it has been caused by dust. Supergiant stars regularly spew out some of their material into space, where it may condense into grainy particles, temporarily blocking the light of the star.
So, no supernova? Well, on the long term, it will. Betelgeuse is dying and will go supernova. That can happen in our lifetime, but it can also take 100.000 years or even more (see the table above with lifetimes of the various fusing phase).
I will end this post with two short paragraphs about related topics.
This blog is about massive stars. Our Sun, a dwarf star, has not enough mass to become a supernova. After exhausting the hydrogen in its core (in about 5-6 billion year) , it will start fusing helium into carbon and oxygen and become a red giant star, swallowing the inner planets, Earth included. But there the fusion stops. Gravity takes over, and the Sun will end as a white dwarf.
In massive stars, fusion ends when the core has become iron & nickel, because further fusion would need energy instead of releasing it. However, during the supernova explosion so much energy is released that elements heavier than iron can be created. Our Sun is a second-generation star, it was formed from an interstellar cloud that contained, besides hydrogen and helium, already material from earlier supernovae. Earth and everything in it, consists of atoms that have been formed in the interior of stars. We are Star Children, each atom in our body (except hydrogen), has been created inside a star!
A list was prepared of 112 exoplanets and each exoplanet was assigned to an IAU member state. The member states had to organise a public competition to find a suitable name for the exoplanet and its host star. The campaign started in June 2019 and on 17 December the chosen names have been published.
The exoplanet assigned to the Netherlands was HAT-P-6b, orbiting the star Hat-P-6 . Hat-P-6 is a star in the constellation Andromeda, at a distance of 910 lightyear, 30% more massive and also hotter than our Sun. The exoplanet Hat-P-6b has been discovered in 2007 through the transiting method.
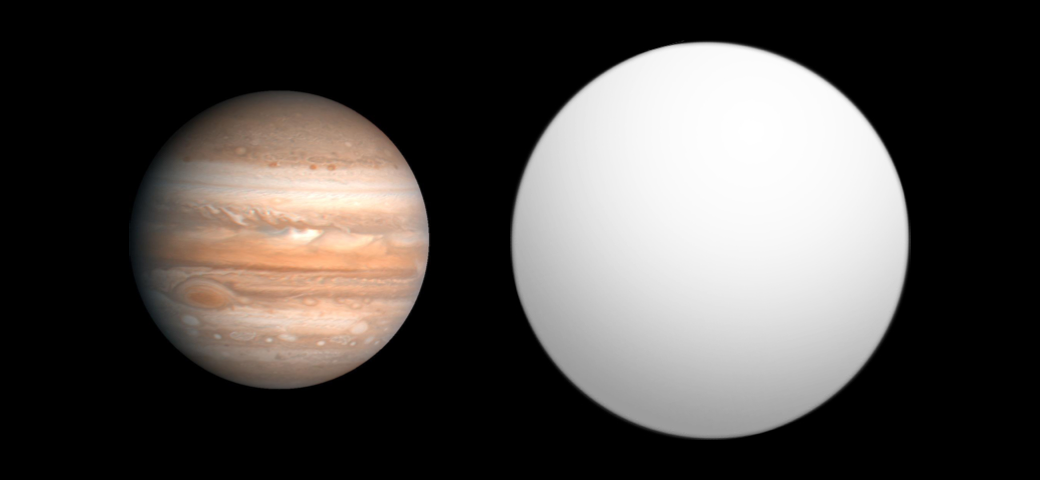
It is a gas giant, slightly heavier than Jupiter, orbiting in less than 4 days around its host star. It is an example of what are called Hot Jupiters. Not suitable for life. Here is an image how Hat-P-6b might look like. Much larger because it is hot.
In the Netherlands the public came with more than 6000 suggestions. Most popular were the names Nijntje (for the planet) and Moederpluis (for the star). They are Dutch cartoon characters, famous all over the world. Here is a Japanese version.
A problem was that theses names are copyrighted, so finally number 2 on the shortlist was chosen. Night Watch for the planet and Starry Night for the star.
The Night Watch is a world famous painting by Rembrandt (1642).
And Starry Night is another famous painting, by van Gogh (1889). Now in the Museum of Modern Art in New York.
Are you interested about other exoplanets in the list? Click here and type the country name in the search box.
Or maybe you want to know which names other countries have chosen for their planet and star? Click then here .
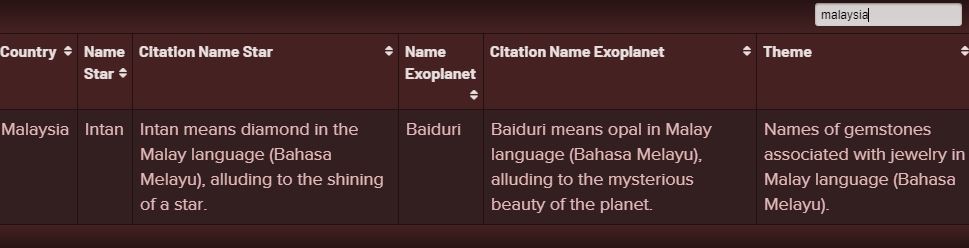
As Malaysia is my 2nd home, I will show the results for Malaysia. Here are the exoplanet and the host star
HD 20868 is an orange dwarf star in the constellation Fornax, 156 lightyear away from us and 25 % smaller than the Sun. Its planet HD 20868b is also a gas giant, but orbiting farther away from its star in about 1 year. In the habitable zone, but as it is a gas giant, probably not very suitable for life.
I have no info about the campaign, apparently 1635 proposals have been made. Here is the final choice: the planet and star have been named after the Malay names of gemstones , Baiduri (Opal) for the planet and Intan (Diamond) for the star.
It is quite fun to see what other countries have chosen!
The Nobel Prize for Physics has been awarded this year to Jim Peebles for ” theoretical discoveries in physical cosmology” and to Michel Mayor and Didier Queloz for “the discovery of an exoplanet orbiting a solar-type star”.
In this post I will concentrate on Jim Peebles, maybe in a later post I will write more about the discovery of the other two physicists.
The scientific career of Peebles is closely associated with the Cosmic Microwave Background (CMB) radiation, so I will first explain what it is and how it was discovered.
According to the Big Bang theory, the Universe came into being 13.8 billion year ago. Incredibly tiny, hot and dense, it started to expand, while cooling. In the beginning it was a soup of gluons and quarks, but after a few minutes (!) the temperature had dropped so much that “normal” matter, like protons, neutrons and electrons became stable and even some light elements like deuterons and alpha particles could be formed. But it was still a plasma for many thousand years, until after around 380.000 years the universe had cooled so much that electrons and nucleons could form neutral atoms, like helium and hydrogen. From that time onwards until present photons could travel freely, the Universe had become transparent.
In the 1960’s Dicke and Peebles at Princeton studied this Big Bang theory, which was still not universally accepted at that time. If the Universe started with a “primordial fireball” , remaining radiation of this fireball should still be present. But the Universe has expanded about 1000 times since it became transparent, so the wavelength of that radiation has also increased 1000 times! No longer visible (reddish) light, but microwaves with a wavelength in the order of cm/mm’s, corresponding to a temperature of only a few Kelvin.
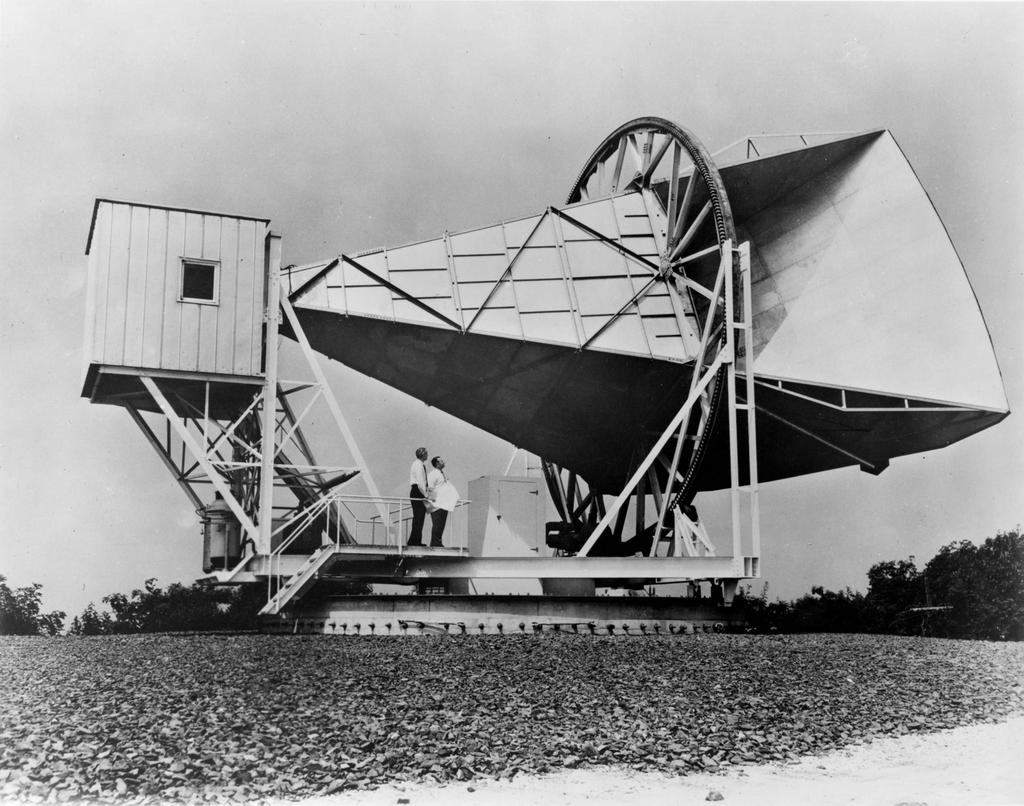
To detect this kind of radiation you need a microwave radiometer , and two colleagues of Dicke and Peebles, Roll and Wilkinson, also at Princeton, were building one. Then they learnt that two scientists at Bell Laboratories, Penzias and Wilson, only 60 km away from Princeton, were actually working wich such a radiometer and had found results they could not explain. Here is a photo of the Holmdel Horn Antenna, used by Penzias and Wilson.
What was it they could not explain? Well, measuring microwave radiation is not easy, because there is much “noise” from many sources, which you have to eliminate or take into account. What they found was that there always remained a background corresponding to a absolute temperature of 3.5 Kelvin. It did not matter which part of the sky they pointed the horn to, and whether it was day or night, there was always this background. They even cleaned the inside of the horn, removing pigeon droppings!
When the two teams came together, the solution was immediately clear. Penzias and Wilson had inadvertently discovered the Cosmic Microwave Background radiation, predicted by Dicke and his team. “Well, boys, we’ve been scooped “, Dicke supposedly said.
In 1978 Penzias and Wilson received the Nobel Prize for Physics “for their discovery of cosmic microwave background radiation” Of course many in the scientific community found that the Nobel Prize should have been awarded to both teams. But (old fashioned) Nobel Prize rules made that impossible, teams can not get the Nobel Prize, only individuals (maximum three).
Roll and Wilkinson continued with their experiment and published the results the next year in the Physical Review Letters: ” Cosmic Background Radiation at 3.2 cm-Support for Cosmic Black-Body Radiation. Searching information for this post, I found a fascinating article, written a few weeks ago by Peter Roll, now retired of course, about his perspective on the 1965 discovery of the CMB. VERY readable, also for non-physicists.
I have written in some detail about the discovery of the CMB radiation because the importance of this discovery can hardly be overestimated. It changed the Big Bang theory from a controversial hypothesis into the standard model for the evolution of the universe. Here is another very readable article in Physics Today, one year after the discovery: A Bang, not a Whimper?
Of course there were still many questions. If the radiation was really thermal, it should have a well-defined spectrum. And it was of course very convincing that the radiation was the same at each point of the sky, but actually there should be minuscule differences, how else could stars and galaxies have formed, if the early universe was completely homogeneous?
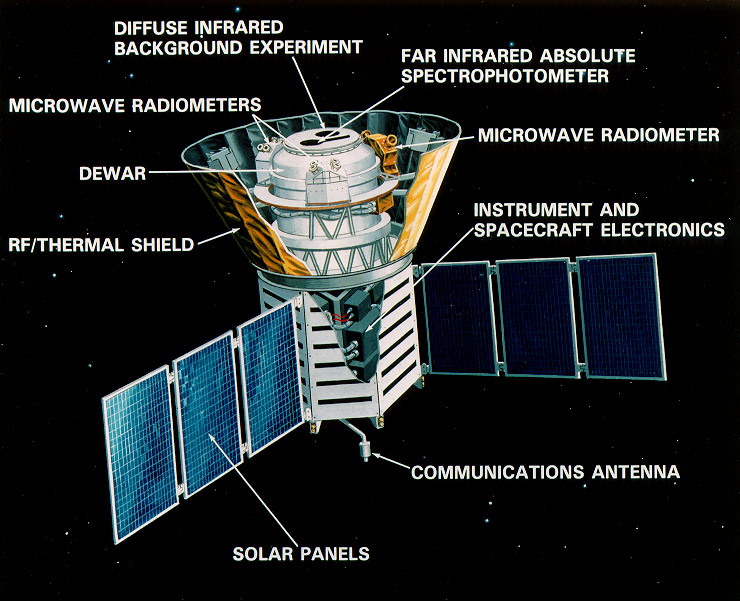
The best way to investigate these questions, was to launch a spacecraft and observe the radiation outside Earth’s atmosphere. And that’s what happened. In 1974 NASA asked for scientific proposals and in 1989 the Cosmic Background Explorer (COBE) was launched. Two main experiments, FIRAS by John Mather, to determine the spectrum of the CMB radiation and DMR by George Smoot to measure the miniscule differences (the “anisotropy”) of the CMB.
Here is the spacecraft. Dimensions (without solar panels) ~ 4,5 x 2,5 m. The experiments are indicated, the Dewar contained liquid helium to cool especially FIRAS to near absolute zero temperature.
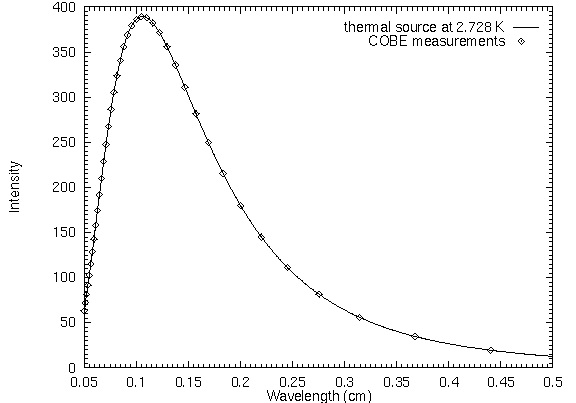
Here are the results. The CMB spectrum fits so perfectly the shape of a thermal source (“blackbody”) that it received a standing ovation when it was presented to the American Astronomical Society in January 1990.
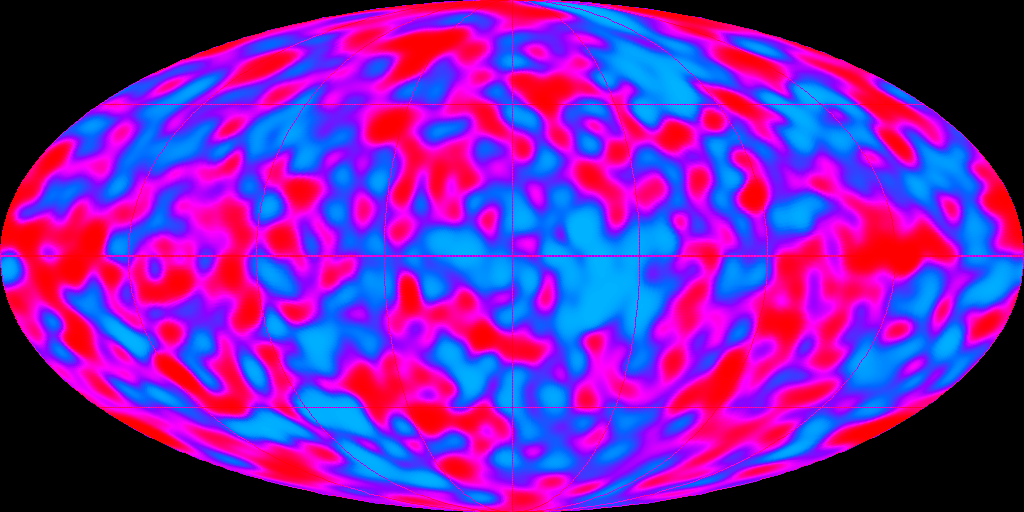
The temperature of the CMB is 2.728 K, but Smoot found indeed tiny differences, depending on the location in the sky. Here is a map of the sky, with the temperature differences indicated in red (slightly warmer) and blue (slightly colder). When these results were published in 1992, they were frontpage news in the New York Times and Stephen Hawking in an interview called it “the greatest discovery of the century, if not of all times”.
In 2006 Mather and Smoot received the Nobel Prize for Physics “for their discovery of the blackbody form and anisotropy of the cosmic microwave background radiation”
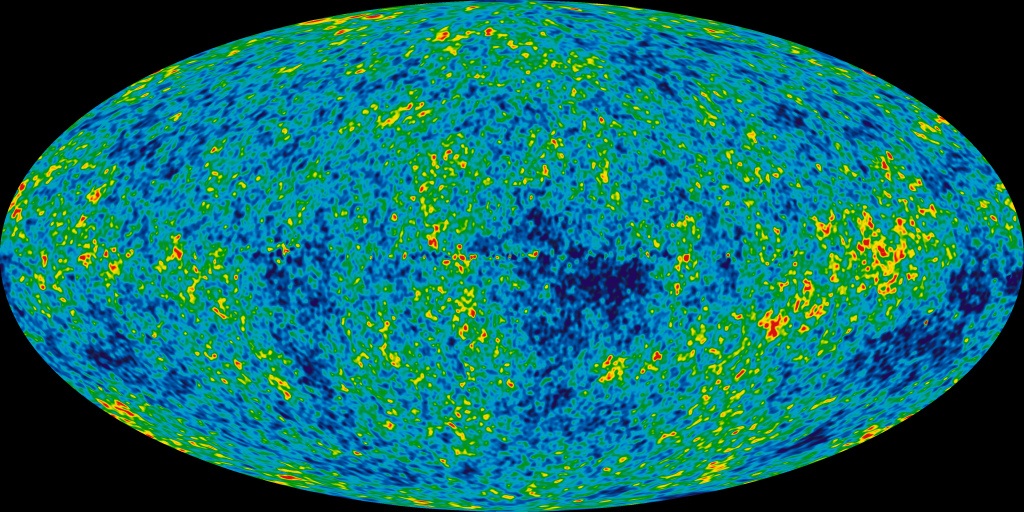
Through the CMB we are looking back to the very young universe, 380.000 year old, before stars and galaxies were formed. Exploring these temperature differences, may help us to understand the evolution of the universe. But then a more detailed map of this anisotropy is needed!
And in 2009 the Planck observatory was launched. The instruments on board were cooled until 0.1 Kelvin, making it the coldest object in the universe..:-) Here is the Planck map, even more detailed.
You may wonder about the shape of these maps. It is called the Mollweide projection and it minimises the distortion you always get when you project a sphere on a plane. For comparison, here is the Mollweide projection of Earth.
There are two other discoveries in cosmology during the past 50 years that I have to mention, before I can finally come back to Jim Peebles and his Nobel Prize 🙂
The first one was the discovery of Dark Matter. In the 70s the American astronomer Vera Rubin studied the rotation of galaxies like the Andromeda galaxy and found that the outer regions of the galaxies were rotating much faster than expected, based on the visible matter of the galaxy and Kepler’s laws. An explanation could be that galaxies are surrounded by a halo of invisible (“dark”) matter. The existence of this Dark Matter has been widely accepted by the scientific community, but we still do not know yet what it is. According to many physicists, she deserved a Nobel Prize for her research, but she never got it. Because she was a woman? She passed away in 2016, Nobel Prizes can not be awarded posthumously. Here is a necrology: Vera Rubin, invisible to the Nobel Committee.
The second discovery was made in the 90s by two teams of astronomers who were studying the expansion of the universe. The Big Bang theory predicted that the expansion would slow down, because of the force of gravity. The crucial question was: will this force be big enough to stop the expansion, followed by a contraction, ending in a Big Crunch, or will the expansion go on forever. The result of their research was shocking: the expansion is not slowing down, but accelerating! There must be a repulsive force, which was called Dark Energy. Also here we do not know what it is. In 2011 the leaders of the two teams were awarded the Physics Nobel Prize “for the discovery of the accelerating expansion of the Universe through observations of distant supernovae”. I wrote a blog about it: Physics Nobel Prize (2011).
So, what did Jim Peebles discover? Nothing actually, and that may have been a reason that he received the Nobel Prize so late in life (he is now 84 year old) as the Nobel Committee has a preference for (experimental) discoveries.
But Jim Peebles rightly deserves the Nobel Prize because he has been instrumental in developing the theoretical cosmological framework for what is called physical cosmology. In 1982 he published a groundbreaking article about a cosmological model with dark matter in it and in 1984 an article in which he added the cosmological constant Λ (now called dark energy) to his model. This model , the Λ CDM model, is at present the standard model of cosmology. For this work Peebles could (should) have been awarded the Nobel Prize many decades ago! Well, better late than never 🙂
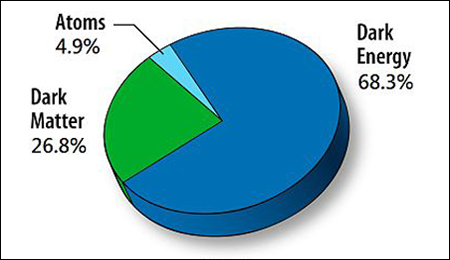
With this Λ CDM model, using the properties of the CMB radiation and other experimental results, it is possible to determine how much normal matter, dark matter and dark energy there is in the Universe. The best fit to the (Planck) CMB data is obtained with the following values:
Atomic matter 4.9 %
Dark Matter 26.8 %
Dark Energy 68.3 %
Probably most of you will have seen this result. Everything we observe around us, our earth, the sun, the planets, the galaxies, it is only ~ 5% of our universe. About the other 95% we know basically nothing. Astonishing and mind-boggling.
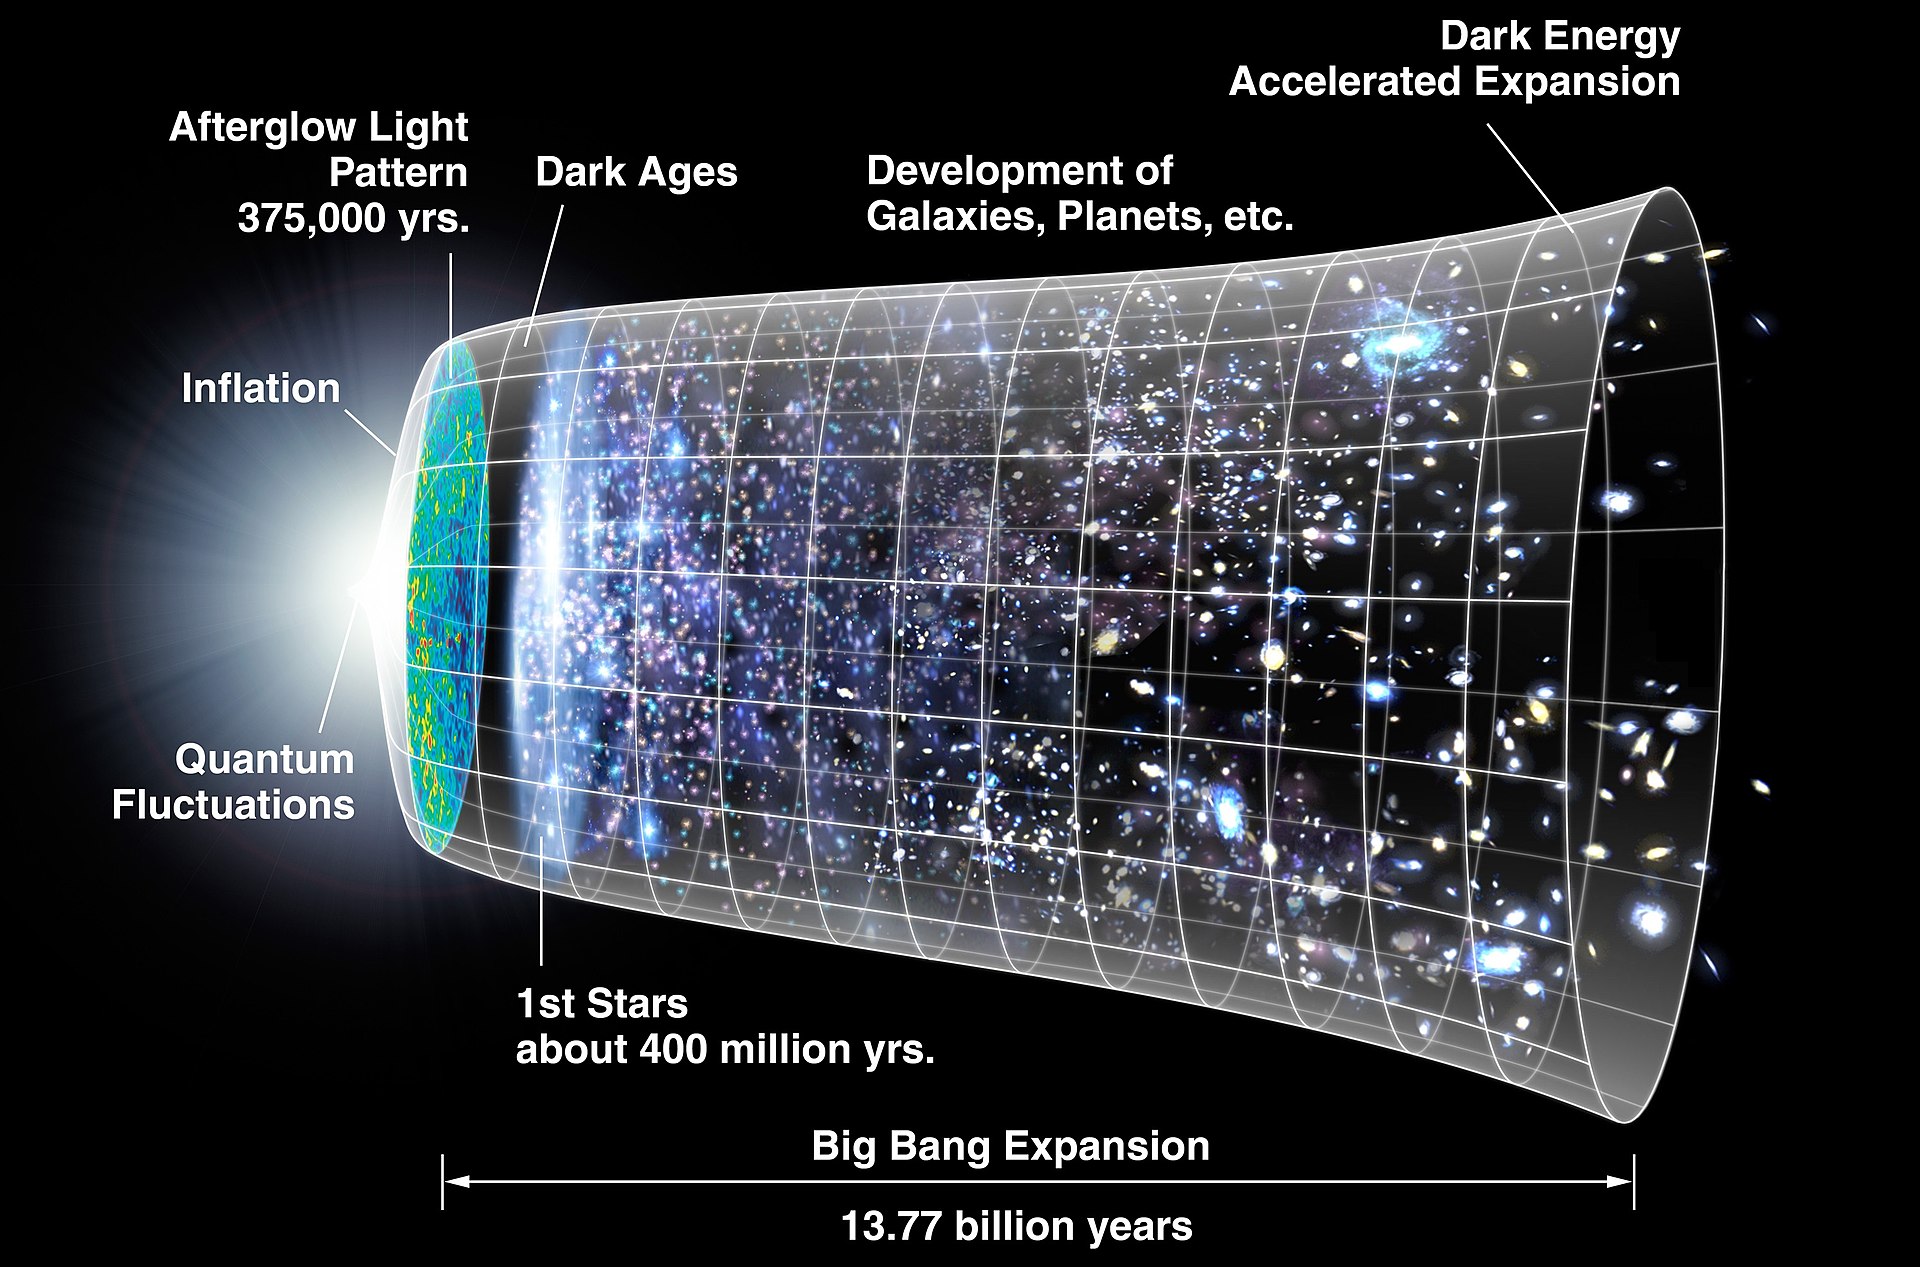
Let me finish this post with two images. Below is an overview of the Big Bang expansion. The CMB is seen to the left, called the Afterglow Light Pattern. To the left you see “Inflation” and “Quantum Fluctuations”. The present theory is that in the first ~ 10−32 (!) second, the universe expanded exponentially. I don’t feel qualified to write a post about it, see the Inflation article in Wikipedia.
When the universe became transparent after 380.000 year, there were no stars and galaxies yet, the universe was dark, except for the afterglow! It took hundred millions of years, before the first stars were formed. More info in Wikipedia’s Chronology of the universe.
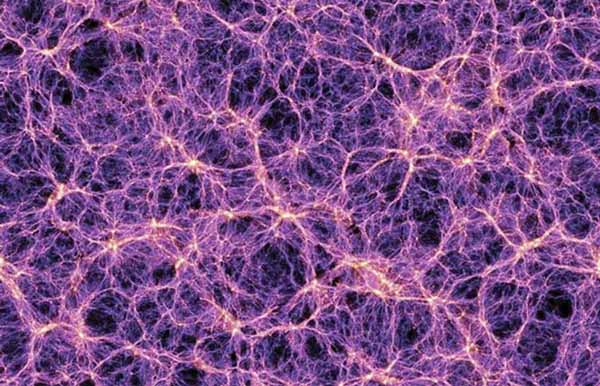
In 1980 Peebles published a book Large-Scale Structure of the Universe and that has always been his primary interest. There are about 200 billion galaxies in the observable universe, are they just randomly distributed? The answer is no, they are part of what nowadays is called the Cosmic Web. They are concentrated along filaments, with huge voids in between. In this artist impression, each light dot is a galaxy. Another mind-boggling image. 🙂 .
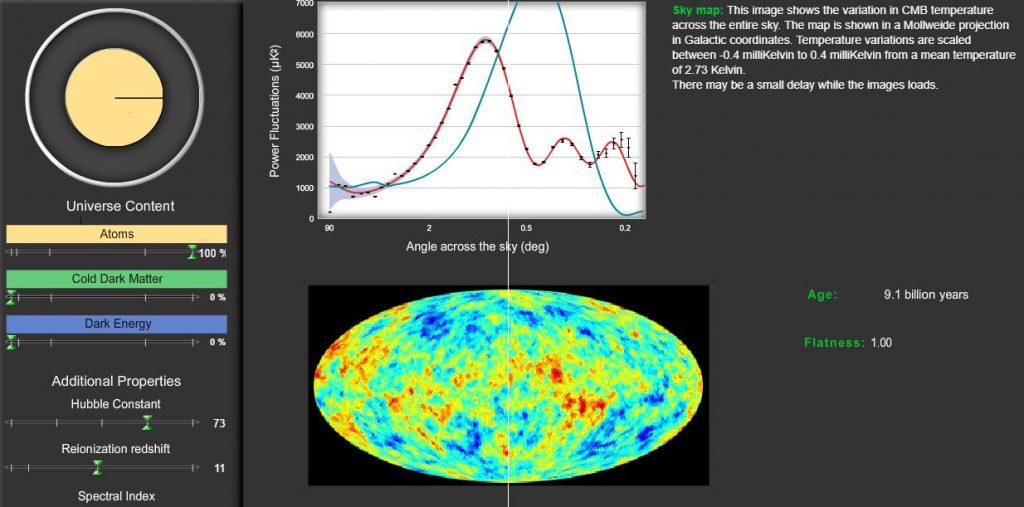
How is it possible to extract the values for dark matter, dark energy etc from a map of the sky with minuscule temperature differences?
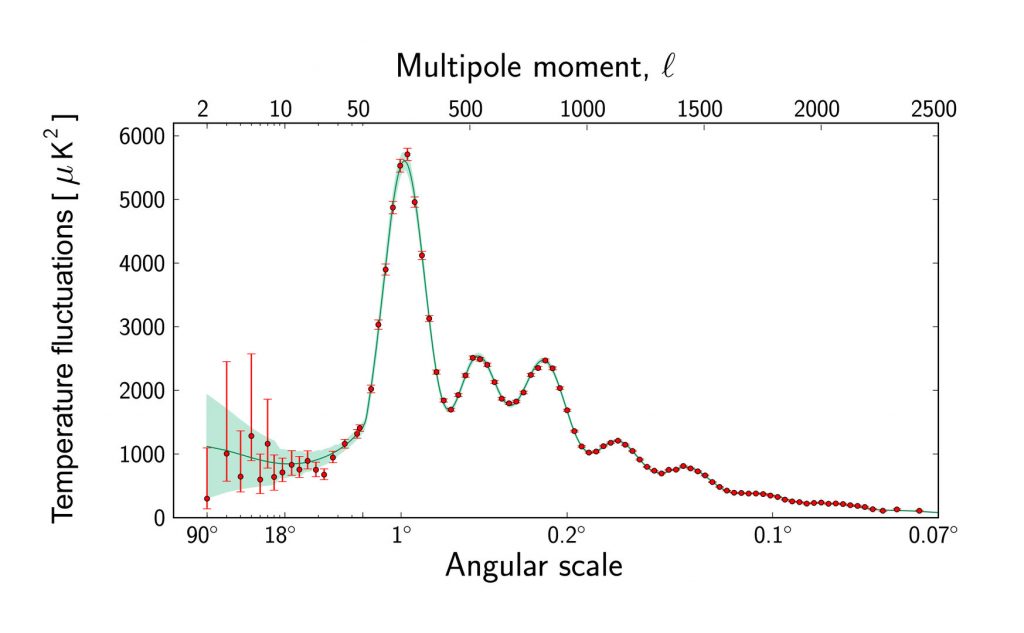
The first step is to “translate” the temperature differences into what is called a power spectrum. The CMB map has cold and warm patches in various sizes. A power spectrum gives the intensity of these patches as function from their (angular) size.
Here is the power spectrum of the PLanck CMB map. The largest temperature fluctuations are found in patches of around 1 degree. Notice that the angular scale runs from left (large patches) to right (small patches). The red dots come from the CMB map. The green line is the best fit from the Λ CDM model, using the parameters given above.
Here is an instructive video, how the different parts of the power spectrum correspond from left to right to increasingly detailed structures.
The calculations are complex and need powerful computers.
In this simulation: Build a Universe you can play around with the various parameters. To run it on your computer, you need to have Flash installed. Not everybody will have Flash, so I have taken two screenshots. The first one, shows the “fit” for a universe with only normal matter. The second one uses parameters like given above.
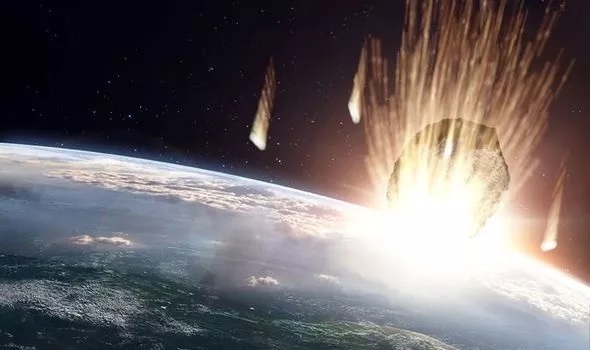
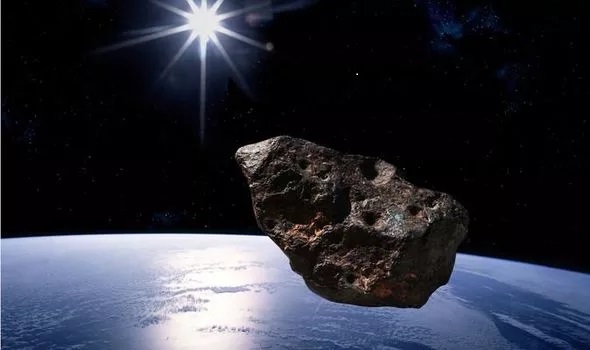
Roughly 66 million years ago the Chicxulub asteroid with an estimated diameter of 10 km struck Earth at the Yucatan peninsula in Mexico. It caused an extinction of 75% of all plant and animal species, including the dinosaurs.
In 1908 the Tunguska meteorite exploded above a remote region in Russia, flattening about 2000 km² of forest. Ongoing discussion if it was a comet or an asteroid. Estimated size 30-80 m.
On 15 February 2013 an asteroid, size approximately 20 m, exploded at an altitude of ~ 30 km above the Chelyabinsk district in Russia. The shockwave caused substantial damage, many people were injured by broken glass.
And last few weeks there has been “alarming” news in the media about several “space rocks” threatening to collide with Earth and cause havoc. Foremost in this was the British tabloid Daily Express. Here are a few of its headlines (click on the image to see the corresponding article)
7 September:
Asteroid shock: NASA warns of ‘100 percent’ chance of asteroid impact
27 September:
Asteroid alert: NASA tracks three space rocks heading past Earth at once – Will they hit?
2 October:
Asteroid warning: NASA panic as four killer space rocks avoid horror impact with Earth
NASA panics, warning of a ‘100 percent’ chance of asteroid impact? Hm, time for a post about asteroids and their danger for Earth 😉
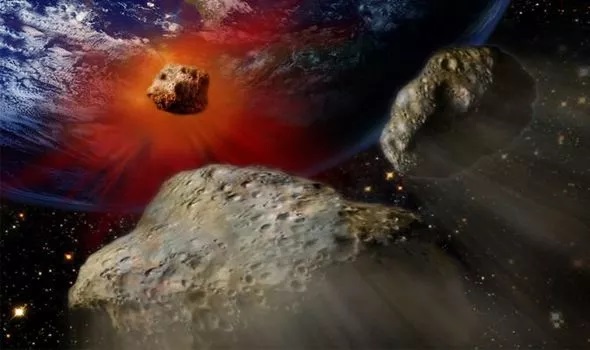
Asteroids are “small” rocky objects, billions of them, orbiting the Sun, most of them in the (main) Asteroid Belt, between the orbits of Mars and Jupiter. Small is relative, more than 150 million are larger than 100 meter and the largest asteroid, Ceres, has a diameter of 945 km! Notice the units, used in the picture below. One AU (Astronomical Unit) equals 150 million km, the average distance between Earth and Sun. This unit is often used for distances in the Solar System. For example, Mars orbits at a distance of ~ 1.5 AU around the Sun and the main Asteroid Belt is located between around 2.2 and 3.2 AU.
There are also asteroids outside the main asteroid belt, orbiting closer to the Sun. When their closest distance to the Sun (perihelion) is less than 1.3 AU , they are labelled Near Earth Asteroids (NEA’s). They are interesting for several reasons. One of them is the possibility of mining them in the future. Another is the possibility that a NEA could come so close to Earth that it might collide!
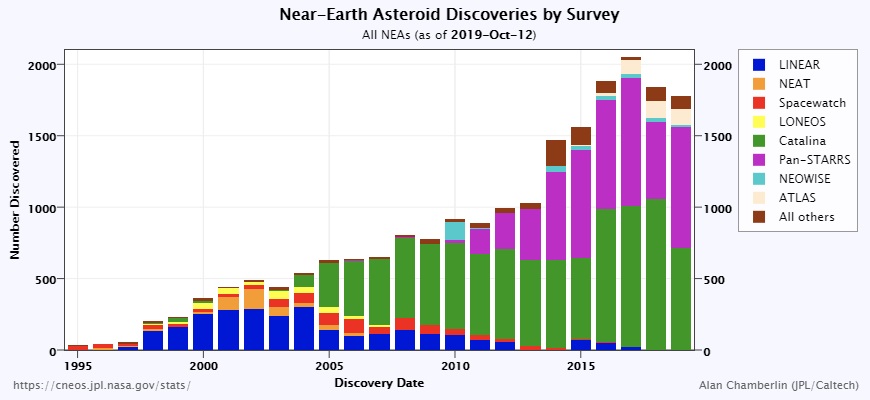
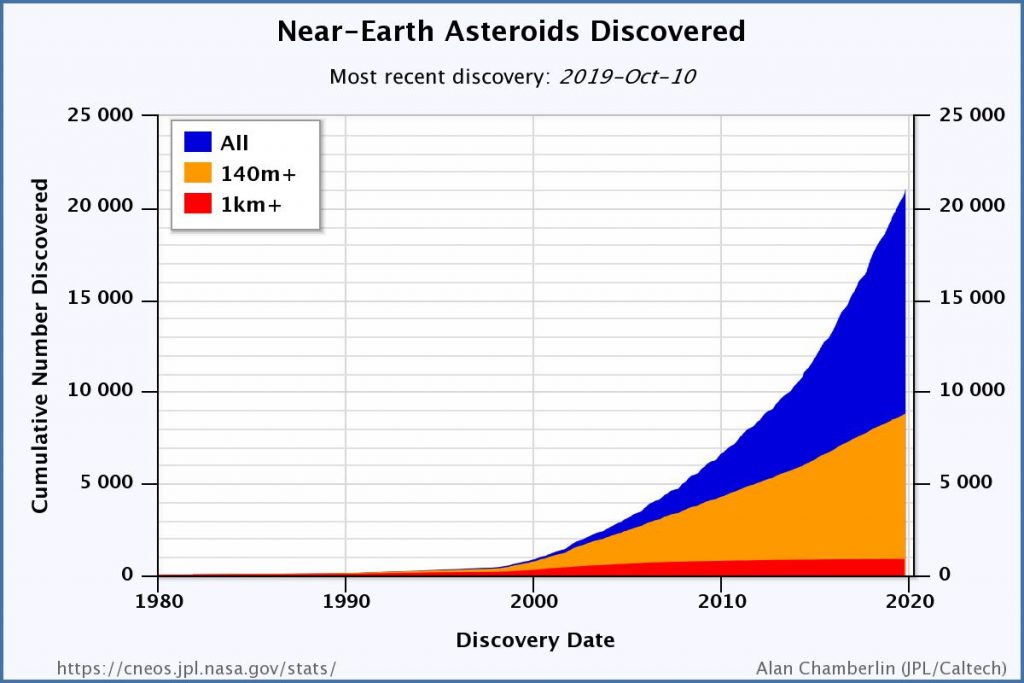
Starting in the 1990’s numerous surveys have been set up to discover and monitor NEA’s. During the last decade the Catalina Sky Survey and the Pan-STARRS surveys have discovered more than thousand NEA’s yearly and every day new ones are discovered. The basic technique is to compare pictures of the sky, taken on different dates and looking for “light points” that have moved, using automated software.
In the figure below the cumulative total is shown (October 2019), split according to the estimated size of the asteroid. Total: 21059 , Larger than 140 m: 8817, Larger than 1 km: 900 (10 October 2019).
Fortunately most of these NEA’s will never come so close to Earth that there is a risk of collision. A subcategory has been defined of Potentially Hazardous Asteroids (PHA), asteroids that come closer to Earth than 0.05 AU and are larger than 140 m. At the moment the number of PHA’s is about 2000. They are of course monitored more closely.
In the left graph the total number of PHA’s is given (from 1999 until September 2019. Each year ~ 100 new PHA”s are discovered. The right graph shows the number of PHA’s larger than 1 km. The last decade only a few more have been found.
Here is a graph showing the orbits of the ~ 1400 PHA’s known in 2013.
After this explanation about NEA’s and PHA’s, you might be a bit scared that the UK tabloids were right in their warnings about imminent asteroid collisions resulting in disasters.
Let’s have a look at Sentry, operated by CNEOS, the Center for Near Earth Object Studies (objects because both asteroids and comets are studied). It is a highly automated impact prediction system, that continually monitors the most current asteroid catalog for possibilities of future impact with Earth over the next 100+ years. At the moment of writing this post, it monitors 945 objects. The probability of impact and the impact energy result in a number on the Torino Scale, comparable with the Richter index for earthquakes.
Here is the reassuring result of Sentry: All the 945 objects have a Torino index 0 ! They form no risk for Earth in the next century.
A few comments
Keep in mind that the Torino Scale is defined only for the next 100 years. There exists another scale, the Palermo scale, that is more sophisticated, with both negative and positive values. The result is the same: none of the objects have positive values.
When a new NEA has been discovered, its orbit is not yet well defined. It happens quite regularly that temporarily such an object has a positive Torino/Palermo index. Subsequent observations reduce the index .
Sentry monitors also NEA’s that are smaller than 140 m and therefore officially no PHA’s.
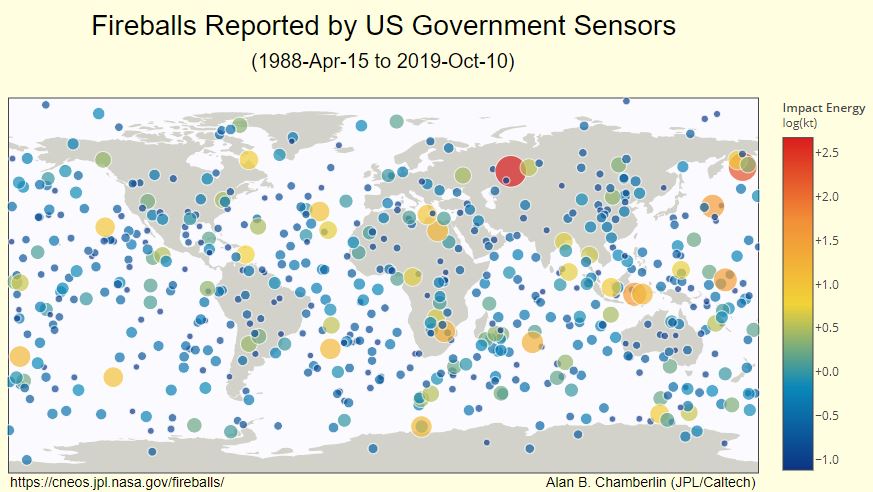
Asteroids, smaller than ~ 20 meter, will disintegrate in the atmosphere, leaving a streak of light, a fireball.
Earth is continuously bombarded from outer space by rocky objects. Every year about 40.000 tonnes. Occasionally a small asteroid, more often remnants of a comet or an asteroid. They are called meteorites and will “burn” in the atmosphere. Here is a map of these fireballs, recorded between 1988 and present. Size and color of the circles indicate the energy of the impact. The large orange circle is the Chelyabinsk asteroid, mentioned in the introduction of this post.
So, what about the scaremongering articles in the media? Here are again the last two captions. In total seven space rocks, horror impacts, NASA panic.
NASA tracks three space rocks heading past Earth at once – Will they hit? NASA panic as four killer space rocks avoid horror impact with Earth
Here are the 7 scoundrels: 2019 SH3, 2019 SN3, 2019 SP. 2019 SE8, 2019 SM8 , 2018 FK5 and 2019 SD8.
The last column gives the closest distance, expressed in the Lunar Distance ( 384402 km) . The size is approximate (see appendix).
Name
Size
Close approach
Distance
in LD
2019 SH3
~ 27m
2019-Sep-30 01:37
1202.000 km
3.1
2019 SN3
~ 16m
2019-Sep-30 11:45
845.000 km
2.2
2019 SP
~ 44m
2019-Sep-30 17:41
2540.000 km
6.6
2019 SE8
~ 5m
2019-Oct-01 13:56
159.000 km
0.41
2019 SM8
~ 15m
2019-Oct-01 15:12
1085.000 km
2.8
2019 FK5
~ 6m
2019-Oct-01 22:56
5094.000 km
13.3
2019 SD8
~ 12m
2019-Oct-02 02:29
532.000 km
1.4
In an appendix of this post I will explain how you can extract these data from the invaluable CNEOS website. In case another alarmist article will published, you can check yourself if you have to get worried 🙂
All seven asteroids are NEA’s, but none of them are Potentially Hazardous Asteroids and NASA will not have panicked at all. Actually these events are common, the past year around 2400 NEA’s have passed Earth, 73 of them even closer than the Moon (like 2019 SE8 in the table above). About 370 of them were PHA’s, but none of them came closer than 7.4 LD’s
Let’s have a look now at the first article
Asteroid shock: NASA warns of ‘100 percent’ chance of asteroid impact
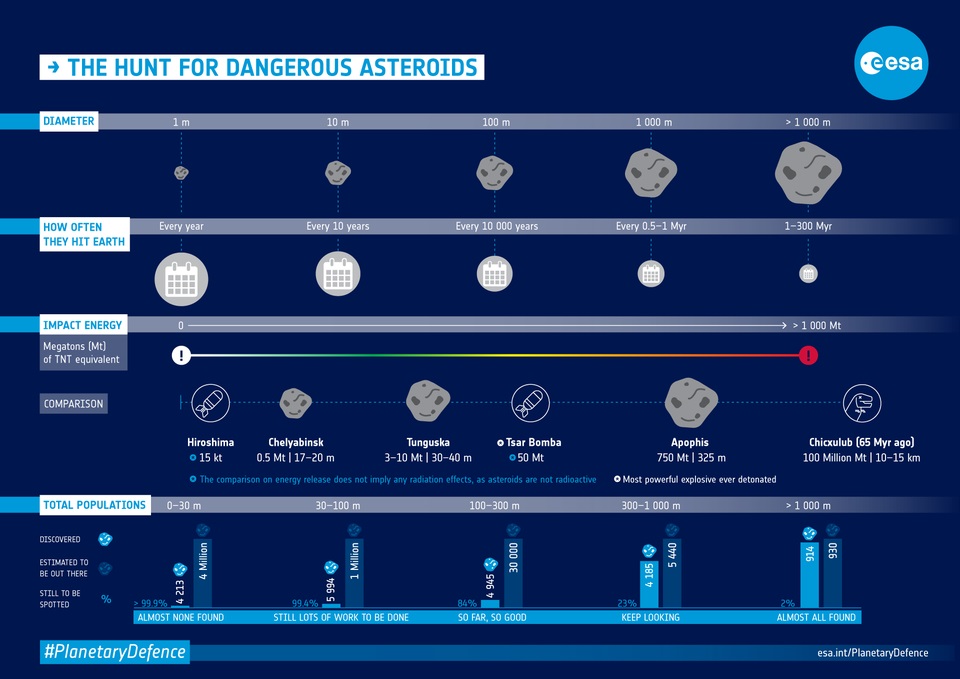
A ridiculous title but the content is much better. Although there are no PHA’s that will hit Earth in the next 100+ years, on a larger time scale it may happen, so humanity should be prepared for such a situation.
Here is a informative infographic created by ESA, the European equivalent of NASA. Notice in the bottom row, how many asteroids in the medium range (100-300 m) still have to be discovered: more than 80 %!
When a big PHA asteroid is discovered on collision course with Earth, there is basically only one realistic option to avoid a disaster: to deflect it. When you are able to do that (many) decades before its impact, a relatively small change in its course might be sufficient. Many ways to deflect an asteroid are described in this Wikipedia article: Asteroid impact avoidance . And bi-annually a Planetary Defence Conference is organized, the last one was held in May 2019, here is the report .
One section of this conference was dedicated to asteroid Apophis, of special interest to me, because I have published three blog posts about it in 2010-2012 😉 . For a while after its discovery in 2004, there was concern that this 370 m big rock might hit Earth in 2036, after a close encounter in 2029. I wrote Will the Earth be hit by Apophis in 2036? followed by a (technical) post Again Apophis . In 2012 the winner of the yearly competition for students and young professionals Move an Asteroid had a winner who proposed to deflect Apophis by paintballing 🙂 My report Paintballing Apophis! explains how he wanted to do it.
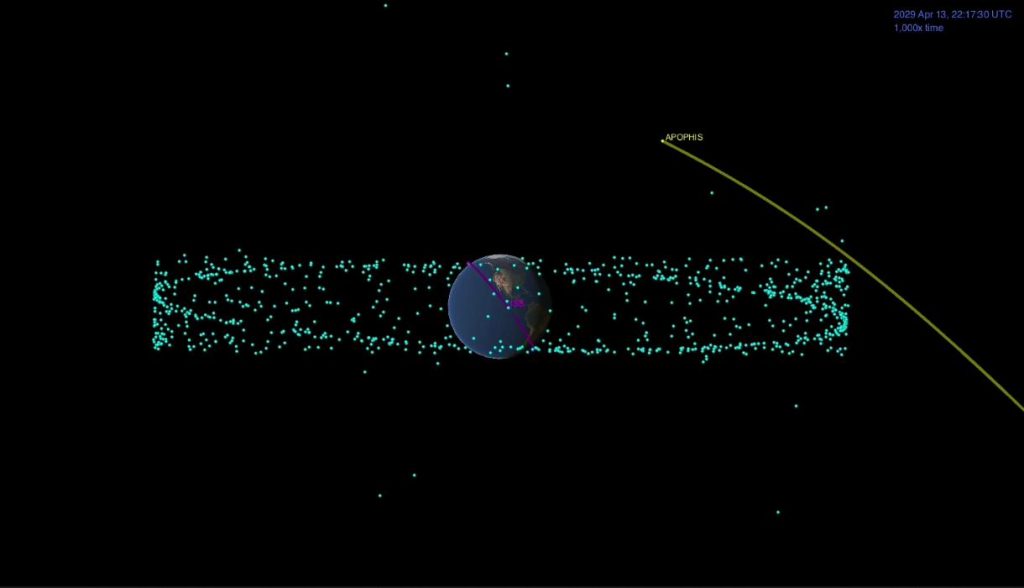
Apophis is not a PHA anymore, but will still pass Earth on 13 April 2029 at the VERY short distance of 31.000 km (less than 0.1 Lunar Distance!), so at the conference there were numerous suggestions how to make use of this opportunity.
Here is a fascinating animation of Apophis, passing Earth on 13-4-2029 (click on the image). All the blue dots are man-made objects, orbiting Earth! The red dot orbiting Earth is the International Space Station.
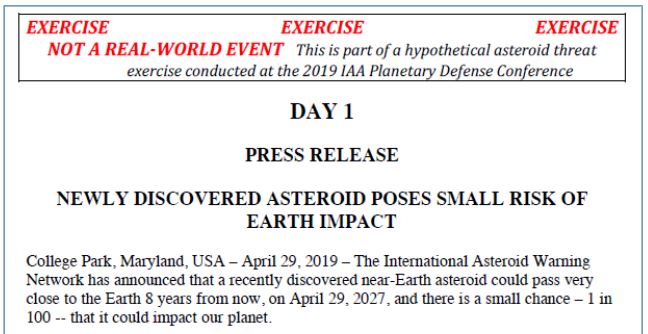
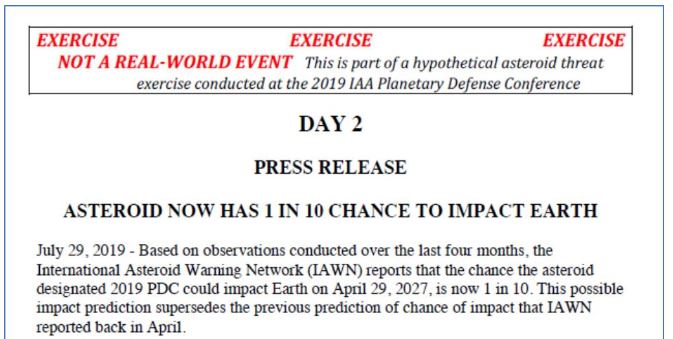
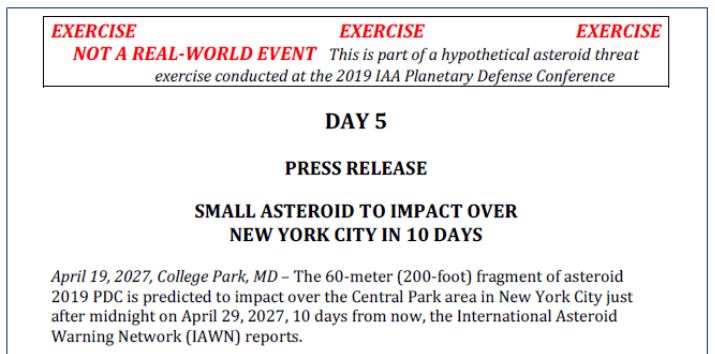
As in earlier conferences, part of the program is a tabletop exercise about a hypothetical asteroid threat. The participants have to discuss how to respond, which action to take, etc. Very realistic, it reads like a thriller. Scroll down to page 31 of the (pdf) report. Here are the “press releases” given daily to the participants.
In the exercise, the participants decided to deflect the asteroid by using Kinetic Impactors, heavy spacecraft that crashes with high speed into the asteroid. It is the most common way to deflect an asteroid.
THEORETICALLY! Because this technique has not yet been tested in a real situation. Quite amazing, and a source of concern for many scientists.
Finally there is now one space mission in progress to test this kinetic impactor technique and I will end this blog with a description of the Asteroid Impact and Deflection Assessment (AIDA) mission.
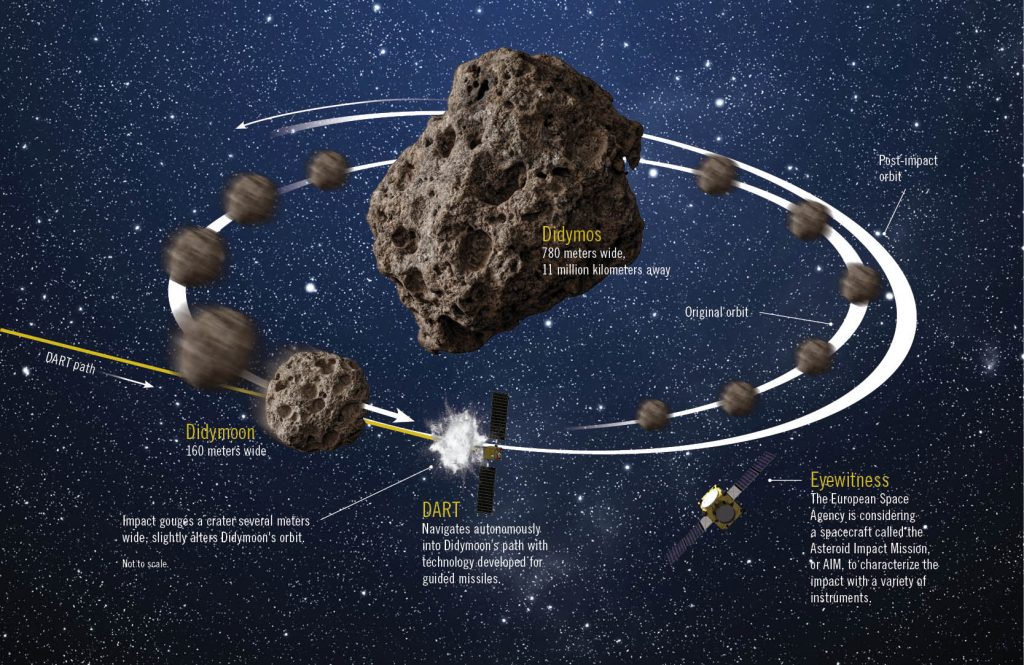
The mission is a cooperation between NASA and ESA and the original plan consisted of two spacecraft, a large NASA impactor called Double Asteroid Redirection Test (DART) and an ESA spacecraft , the Asteroid Impact Mission (AIM), that would watch DART crashing into the asteroid and observe the immediate effects of the impact.
Target of the mission is the asteroid Didymos, a PHA with a diameter of ~ 800 m, discovered in 1996 as 1996 GT . Don’t be surprised, but it has actually a “moon”, nicknamed Didymoon, diameter ~ 170 m, orbiting Didymos in about 12 hours.
This was the original plan: December 2020 AIM was to be launched, to arrive at Didymos in May 2022. It would go in orbit around the asteroid and study Didymos and Didymoon.
Dart would be launched in July 2021, arrive at Didymos October 2022 and crash into Didymoon, while AIM was watching! After the crash AIM would measure the change in Didymoon’s orbit, to see if this Kinetic Impactor technique is an effective way to deflect dangerous asteroids in the future.
Here is an artist impression of the mission.
And here is a very informative video, prepared by ESA in 2016 about AIM
NASA decided to continue with the DART mission and measure the effects of the impact on Didymoon using earth-based telescopes instead. And ESA is planning to launch a much simpler spacecraft, named HERA, in 2023, after the crash of DART! After arrival at Didymos it would study the effects on Didymoon. But the decision to actually fly the mission still has to be taken, in November this year.
As an European I feel rather ashamed that Europe has acted this way.
x x x x x x x x x x x
Appendix
In this appendix I will explain how you can find reliable information about any asteroid, when you know its name.
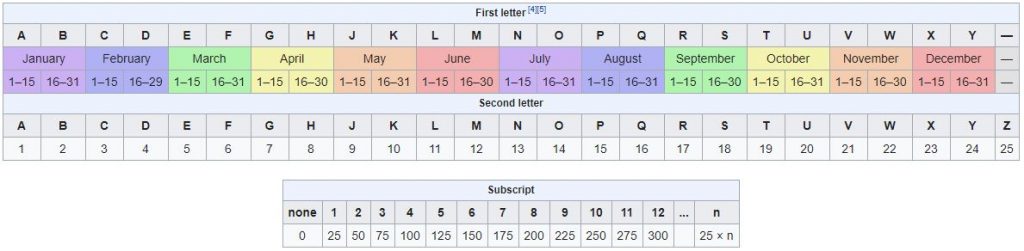
First the naming convention for “minor planets” . The year of discovery is followed by two letters and (sometimes) a number. The first letter gives the half-month in which the object was first observed. The second letter stands for a number 1 until 25. (the I is left out to avoid confusion with the J) and counts the objects, discovered in that half-month. When the system was introduced, probably it was thought that there would not be more than 25 objects discovered in a half-month. But nowadays hundreds of objects are discovered every month! The number tells how many times you have to repeat the alphabet! Here is the coding table.
An example. Recently a NEO has been discovered: 2019 SP3. In the table we see that the S stands for 16-30 September and the P for 15. So this asteroid is the 3 x 25 + 15 = 90th object, discovered in the second half of September 2019.
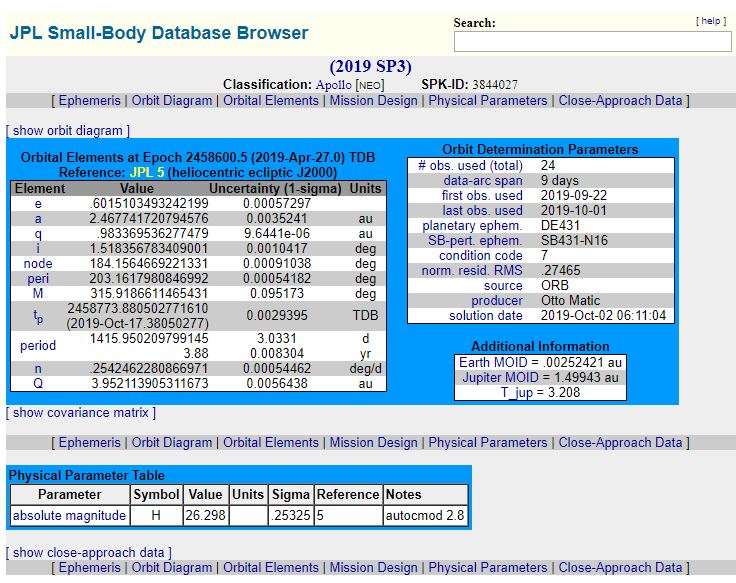
To find the properties of this asteroid we go to the JPL Small-Body Database Browser. Enter the name 2019 SP3 (case sensitive) in the Search box.
Lots of information, mostly about the orbit (left table) and the discovery history (upper right table). Important for us are two numbers in the other tables, the MOID = 0.00252421 AU and the absolute magnitude H =26.98.
The minimal orbit intersection distance (MOID) tells us how close the orbits of 2019 SP3 and Earth can get. 0.00252421 AU = 378000 km. Less than the distance between Earth and Moon!
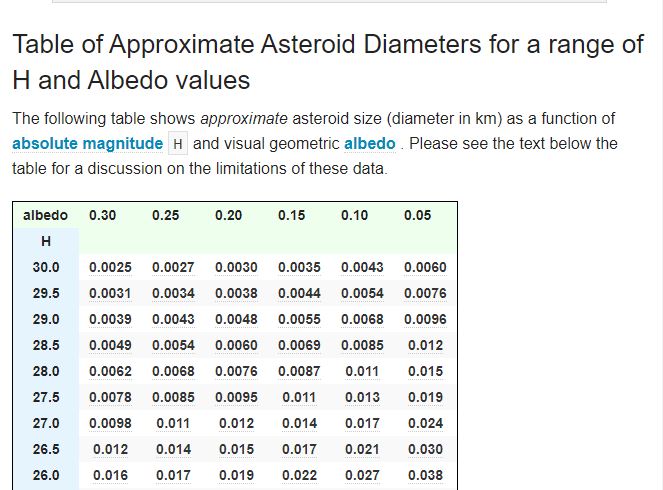
The absolute magnitude H indicates how bright the asteroid is. It gives us an indication about the size of the asteroid. A large asteroid will reflect more sunlight and therefore appear brighter. But this reflection also depends on the structure of the asteroid, is it coal black or more shining. This reflection property is given by the albedo , which can have a value between 0 (no reflected light) and 1 (perfect reflection).
The problem is that we have to guess what the albedo of our asteroid is. In general they are quite dark, with albedo between 0.3 and 0.05. Often a value of 0.15 is used.
Don’t be put off by the title of this blog, I’ll try to keep it simple 🙂
In Greek/Roman times it was thought that Earth was the center of the Universe. The Sun , the planets, the stars were all rotating around Earth.
Now we know that Earth itself is rotating, in 24 hours (although we keep saying that the sun rises in the East and sets in the West).
We also know that Earth is orbiting around the Sun in 365 days. As seen from Earth, the Sun seems to be moving across the sky. This apparent path of the Sun throughout the year is called the ecliptic.
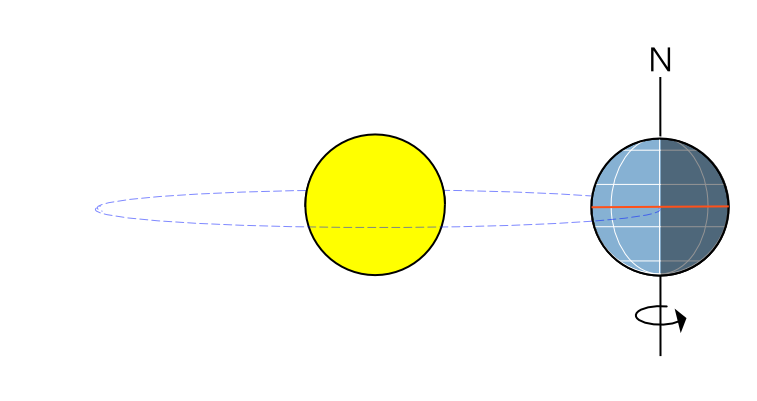
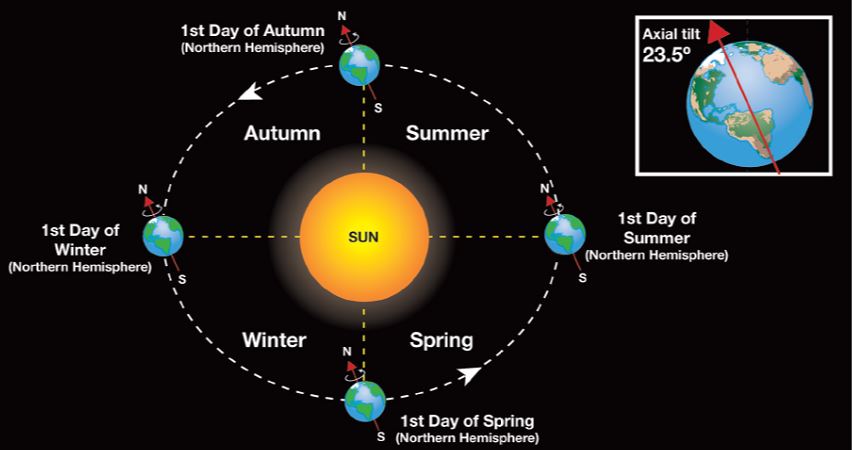
If Earth would be rotating like in the picture below, then during the whole year, the Sun would be above the Equator and there would be no seasons. . Day and night would be both 12 hour, everywhere on Earth, throughout the year.
But everybody knows that this is not the case. In the Northern hemisphere. daylight will be longer than night in summer and shorter in winter, whereas in the Southern hemisphere it is just the other way around. The reason is that the axis of rotation of the Earth is slightly tilted, about 23.5° .
Notice that during Earth’s orbit, the direction of the rotation axis remains the same (pointing to the North Star).
In the picture below we can see what happens in a bit more detail. Let’s start with the 1st Day of Spring (20/21 March), when the tilt is not directed towards the Sun and the Sun is directly over the equator. Day and night are equally long all over Earth, it is called the March Equinox. The same happens on the 1st Day of Autumn (22/23 September), the September Equinox.
From March until June, the Sun moves North, days become longer and nights shorter until the 1st Day of Summer, 21/22 June, the Summer Solstice, after which the Sun moves back to the Equator. From September to December, the Sun moves South, days become shorter and nights longer, until the 1st Day of Winter, 21/22 December, the Winter Solstice, after which the Sun moves back again to the Equator. All this has been described from the perspective of the Northern Hemisphere. For the Southern Hemisphere everything is opposite.
So the axial tilt of Earth is responsible for the seasons and there are scientists who believe that this tilt has been critical for life: Axis Tilt is Critical for Life , but this is quite controversial.
Until now I have been rather vague about the apparent position of the Sun. “Above the Equator”, “moving North”, “moving South”. Actually, we can be much more precise nowadays, using a coordinate system similar to what we use on Earth, with latitude and longitude. But how did the Greek and Romans do that?
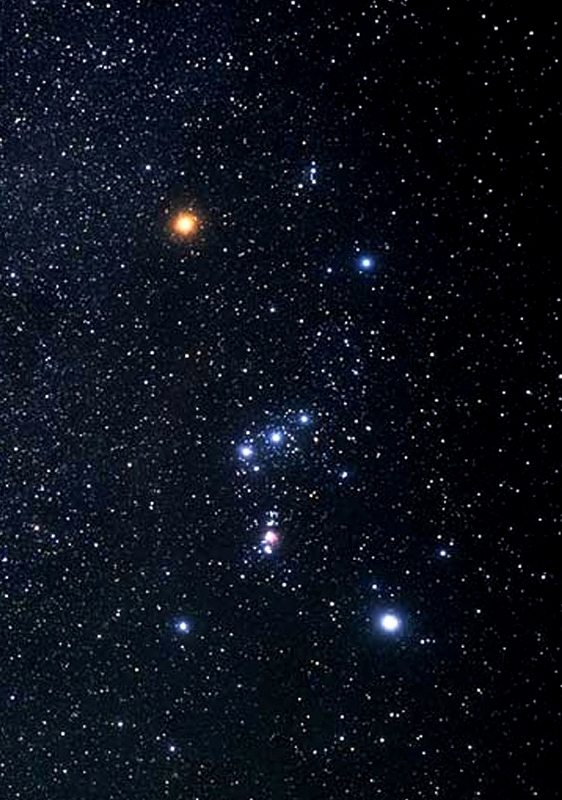
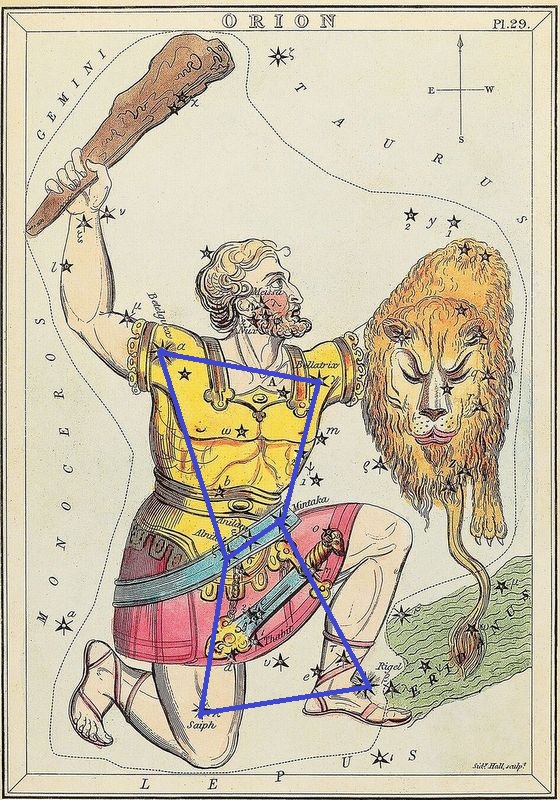
To describe the location of the Sun against the backdrop of stars, the Greeks used the concept of constellations, patterns of stars that were given a name, often based on their myths and religion. A constellation most of you will know is Orion, the mythological Greek hunter. The left photo was taken by the Hubble telescope and shows the characteristic shape of Orion. Right an antique star chart, published in 1824. To guide the eye, I have connected the main stars with blue lines
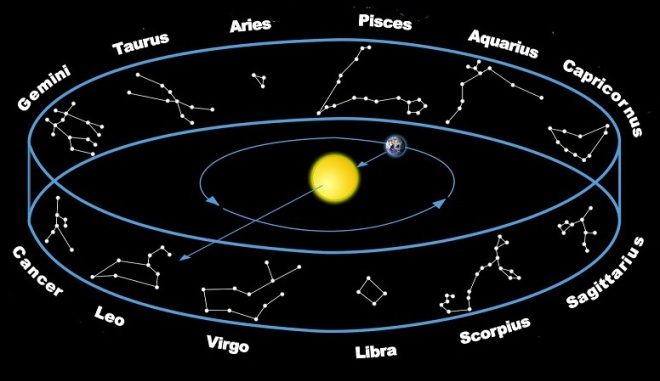
During a year, the Sun crosses twelve of these constellations , as indicated in the image below. These twelve constellations are called the Zodiac. The names of the constellations may be familiar to you, if you know your (Western) horoscope 😉 .
At the moment that this post has been published , the Sun has left the Leo constellation and entered Virgo.
Nowadays many more constellations have been defined (88!), covering the whole sky. Below you see a map of the celestial globe. The Celestial globe is similar to the Earth globe, but everything is projected to the “sky”.
Notice that the horizontal scale (Right Ascension) is not in degrees, like longitude on the Earth globe, but in hours and going from right to left. Same as on the Earth globe the choice of the origin (zero) is arbitrary. On the Earth globe it is the Greenwich meridian, on the Celestial Globe it is the March Equinox. The traditional name for this origin is the First Point of Aries.
The name was coined by the Greek astronomer Hipparchus, who lived from c 190 BC until c 120 BC. At that time the Sun had just entered the Aries constellation during the Spring Equinox. The March Equinox is indicated by the Aries symbol ♈︎ .
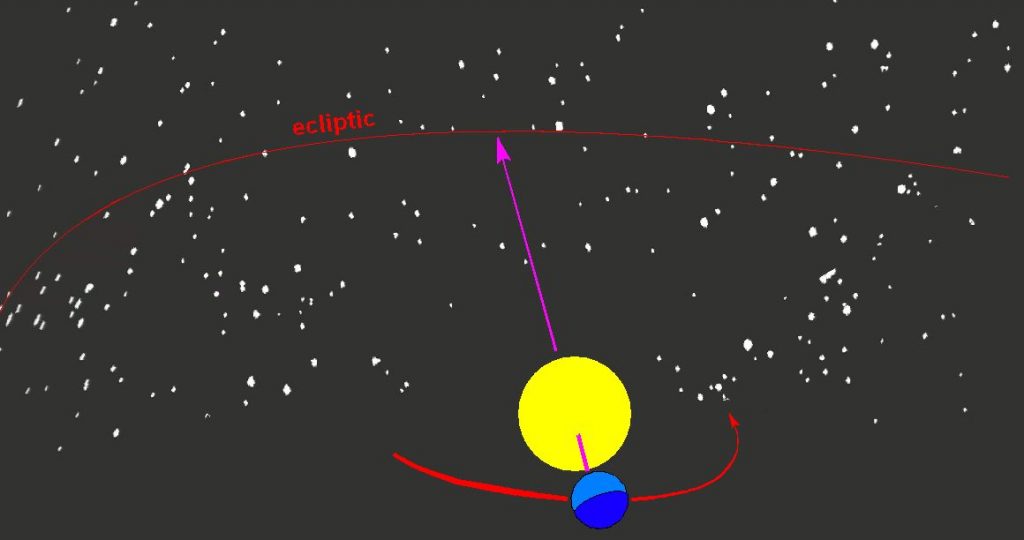
The ecliptic is shown, with the constellations (in white) which the Sun is passing throughout a year. Following the ecliptic from right to left, you will notice that it starts at 0h in Pisces, the Sun moves North until 6h (Gemini) then back to the equator at 12h (Virgo), going down South until 18h (Sagittarius) and back to Pisces for the next cycle.
Do you notice the contradiction? The First Point of Aries is now located in Pisces! How can that be? Time to talk about the Precession of Earth!
Above I wrote that the rotation axis of Earth, during its orbit around the Sun, is always pointing in the same direction (to the North Star). That is correct at the moment, but not forever, because there is a third movement of Earth.
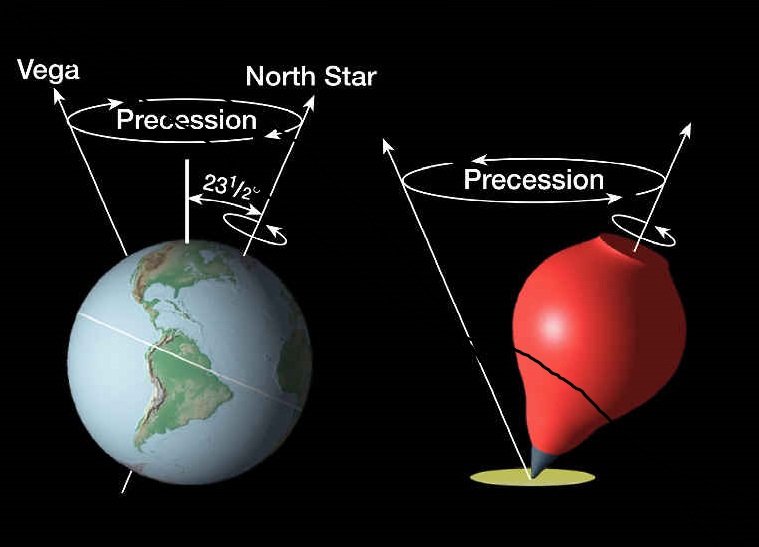
Probably many of you have been playing with spinning tops. When a top (or a gyroscope) is spinning, it will often “wobble” under the influence of the force of gravity. The same happens with the Earth under the influence of the gravitational force of Sun and Moon. This wobble is called Precession.
Here is a short video about the precession of a gyroscope
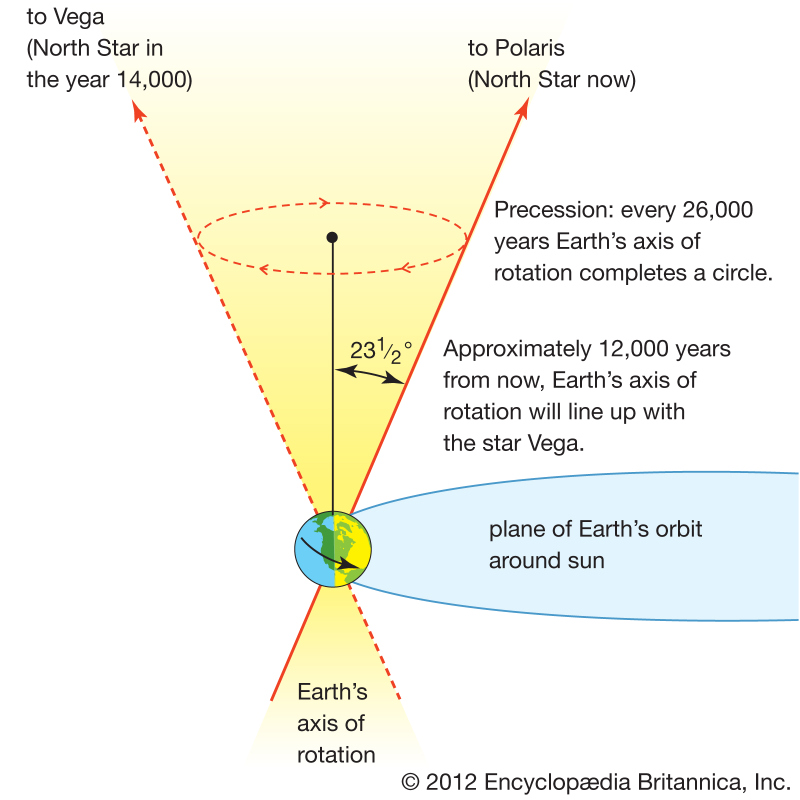
The Precession of Earth is a very slow process. One round takes about 25800 year. Here is an animation of the process.
The red line connects the two equinoxes, the March Equinox is marked with the Aries symbol. Notice how the March Equinox passes all signs of the zodiac during one precession. 360° in ~ 25800 year, means a shift of 1° every 72 year. Since Hipparchus’ time, the First Point of Aries has shifted ~30° , it is no longer in Aries, but in Pisces and will cross over to Aquarius around 2600 AD.
The second part of the video shows how the North pole points to different stars during a precession. In the picture you see that “today” it is pointing at Polaris (the North Star) , but in 3000 BC it pointed at the star Thuban, and in 14000 AD it will point close to the bright star Vega.
To summarise, here is a picture, with the three movements of Earth, the daily rotation (24 hours), the yearly orbit around the Sun (~365 days) and the precession of the rotation axis (~25800 years).
Notice that the rotation of Earth and its orbit around the Sun are counterclockwise , while the precession is clockwise! So the yearly motion of the Sun through the Zodiac goes from Pisces to Aries to Taurus etc. But the Spring Equinox has, since Hipparchus , shifted back from Aries to Pisces and will shift to Aquarius around 2600 AD.
Let me end this post with some explanation about why I decided to write it.
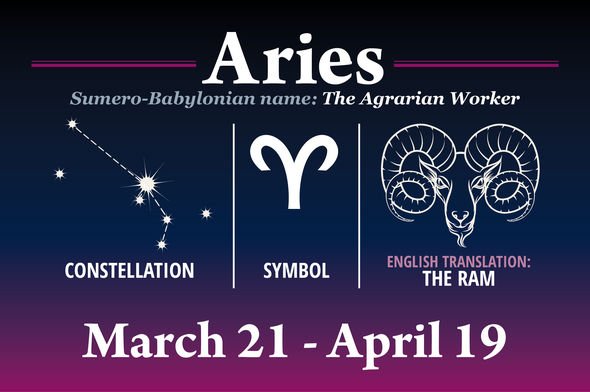
Everything written above belongs to the realm of astronomy. Unfortunately there exists also astrology, a pseudoscience. Basically astrology states that the position of the heavenly bodies affects our lives. For example, an important factor is the location of the Sun on the day that you were born. That becomes the sign of your horoscope. Here is an example:
I was born on 17 April, therefore I am a Ram. But that is nonsense, maybe true in Hipparcos’ time. Because of the precession I was actually born when the Sun was in Pisces (12 March – 19 April)
Of course astrologers are aware of the precession, see for example Sidereal and Tropical Astrology. for various “solutions”.
Directly related to precession is the concept of Astrological Ages. As explained above, during one precession of 25800 year, the March Equinox traverses all 12 signs of the Zodiac, staying in one sign on average 2150 year. Such a period is called an Astrological age. At the moment we live in the Age of Pisces.
Astrologers claim that each age is characterised by certain properties. For example the Age of Pisces is the age of religion, the Age of Aries was the age of war and the coming Age of Aquarius will be the age of freedom.
You will not be surprised that in my opinion these Astrological Ages are even more nonsense than horoscopes.
A few months ago a friend told me about Matias de Stefano, who calls himself an Indigo Child and has memories from an earlier life in Atlantis. He is 29 year old and has many followers. I listened to his video lecture Total Recall. Here is a transcription. One quote to give you an impression of the lecture:
We are Beings (indigo/crystal) that come from the 6th to 13th dimension, to try to promote the 4th and 5th dimension inside the 3rd.
But the following statement is so ridiculous that I decided to write this post.
Earth spins around the sun in a process which lasts about 365 days, but at the same time, our Sun spins around another sun which is a lot bigger, called Syria, about every 26,000 years. As a year on Earth, the Sun’s year has its seasons, equinoxes, solstices and ages, too.
Apparently he has not the faintest idea what the Precession of the Equinox means.
I will end this post with a famous song from the 1967 musical Hair. ” This is the dawning of the age of Aquarius “
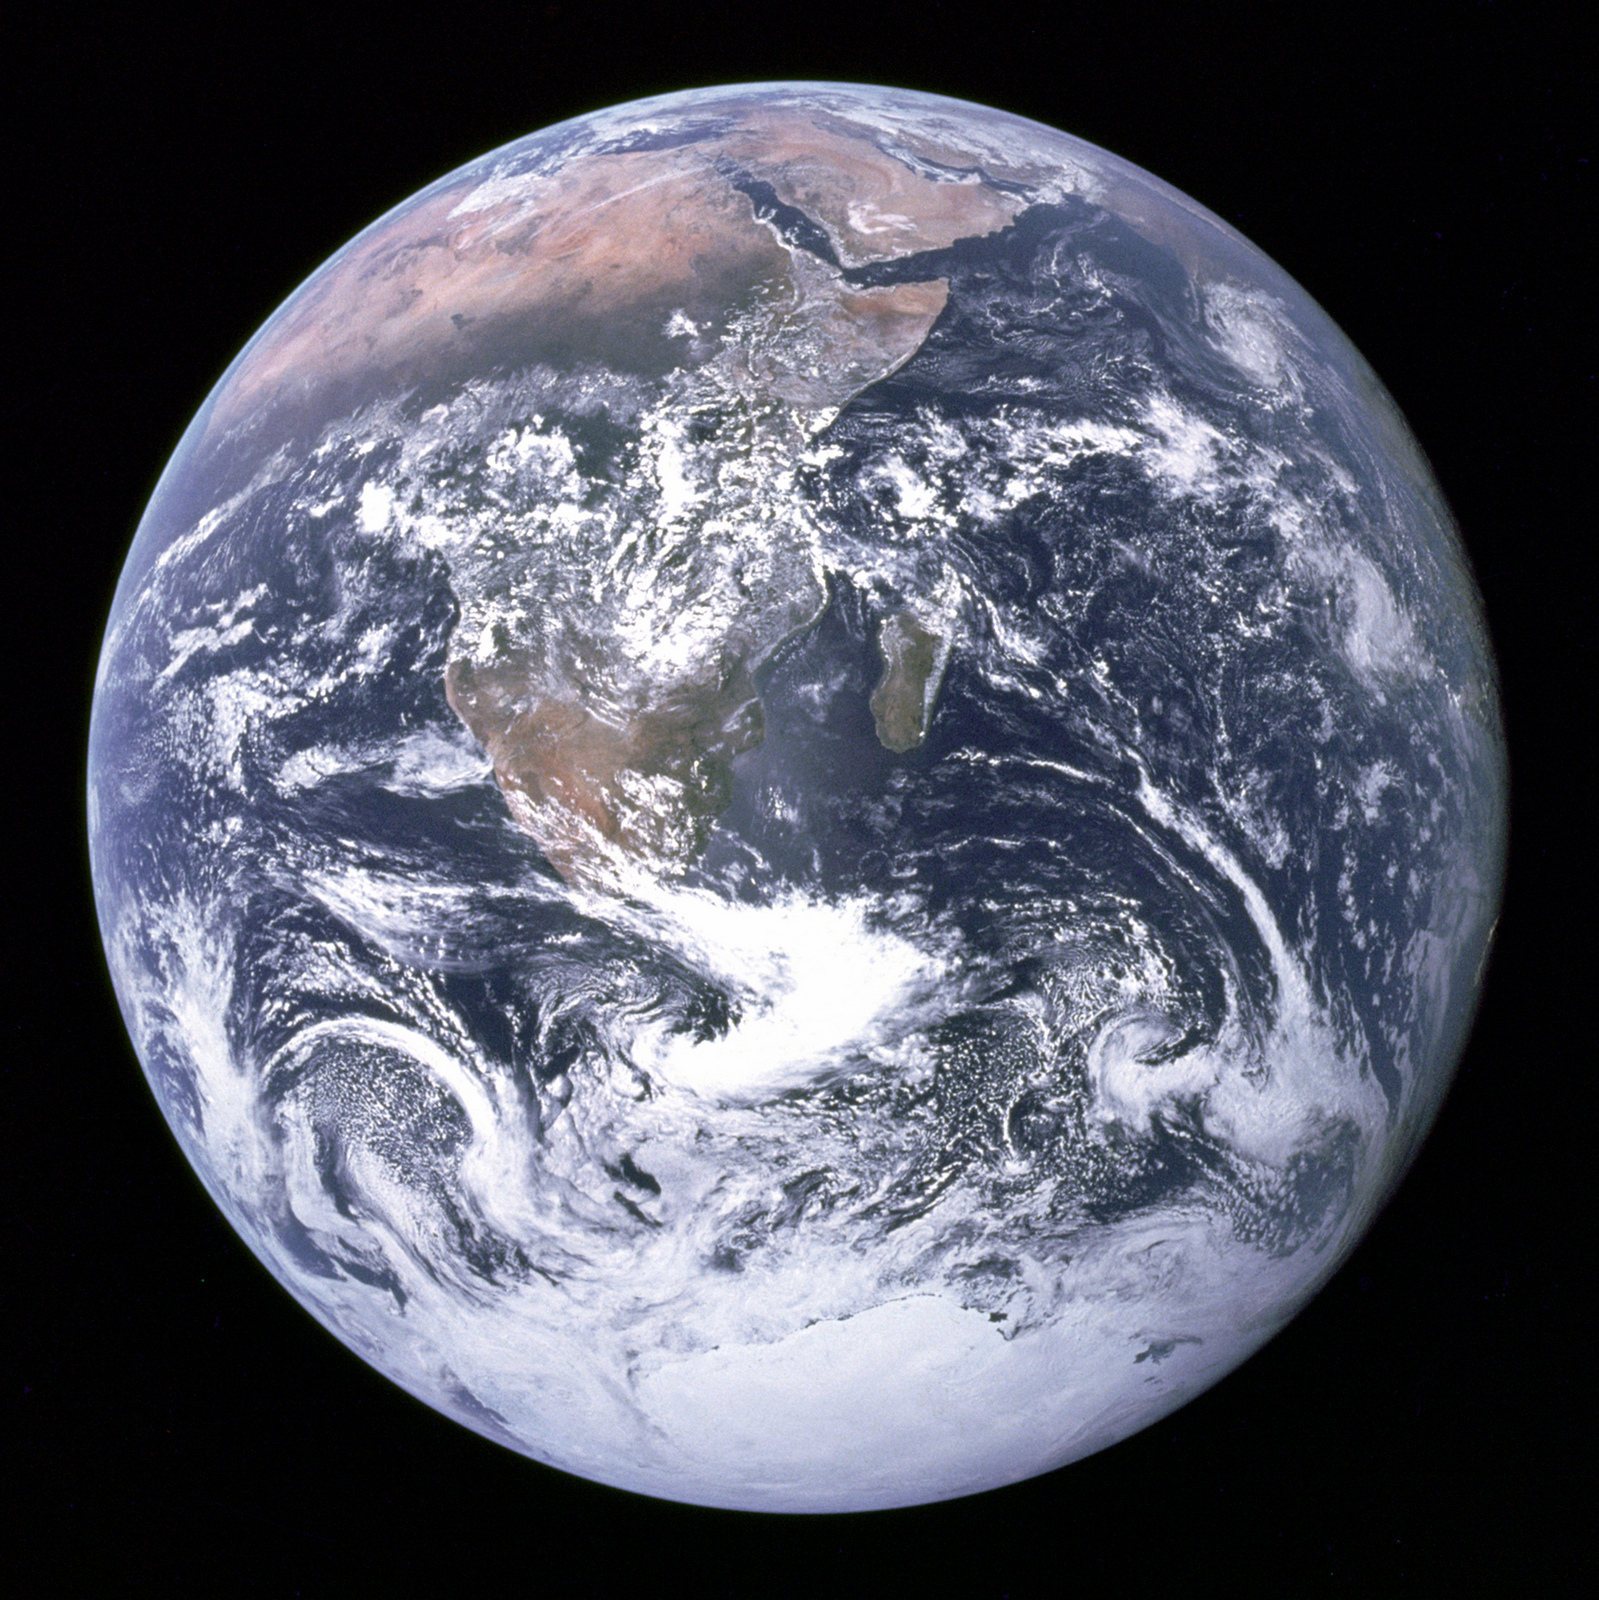
On December 7, 1972, the crew of the Apollo 17 spacecraft, on their way to the Moon, took a picture of Earth at a distance of about 29,000 kilometers. It has been named The Blue Marble and is one of the most reproduced images in history.
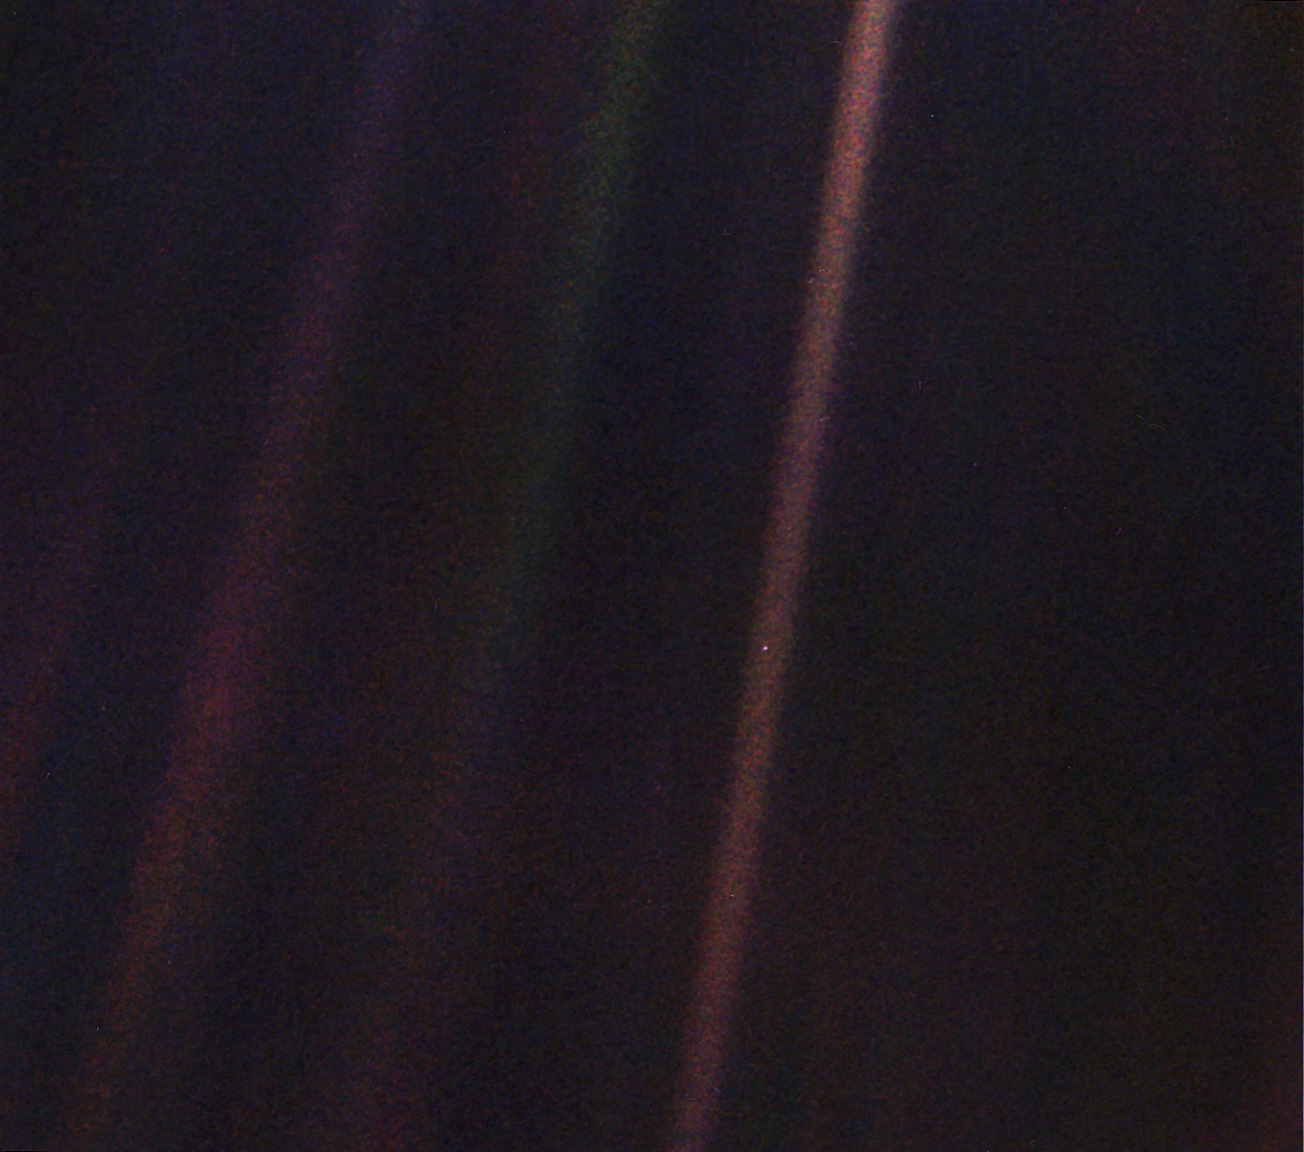
Five years later, in 1977, NASA launched the Voyager 1, to explore the outer solar system. It was a highly successful mission with flybys of Jupiter, Saturn and Titan, Saturn’s largest moon.
After completion of this primary mission and before leaving the Solar System, it was suggested by astronomer and author Carl Sagan, that the Voyager 1 should look back and take one last picture of Earth. This picture was taken on February 14, 1990 at a distance of about 6 billion km from Earth. The picture has been named the Pale Blue Dot , because in this picture Earth is not more than a single pixel. You may have to click on the picture to enlarge it and see Earth more clearly. The coloured bands are artefacts, caused by reflection of sunlight in the camera.
Inspired by this picture Sagan wrote the book Pale Blue Dot in 1994. Here is a quote from this book:
Look again at that dot. That’s here. That’s home. That’s us. On it everyone you love, everyone you know, everyone you ever heard of, every human being who ever was, lived out their lives. The aggregate of our joy and suffering, thousands of confident religions, ideologies, and economic doctrines, every hunter and forager, every hero and coward, every creator and destroyer of civilization, every king and peasant, every young couple in love, every mother and father, hopeful child, inventor and explorer, every teacher of morals, every corrupt politician, every “superstar,” every “supreme leader,” every saint and sinner in the history of our species lived there–on a mote of dust suspended in a sunbeam.
I have used the Blue Marble image for a long time as background on my monitor screen. Recently I have changed it to the Pale Blue Dot.
At the moment Voyager 1 is still (partly) operational at a distance of about 22 billion km from the Sun, speeding away at more than 60.000 km/h.
In this blog I will give updates about three space exploration missions described in earlier posts and report about two new ones.
New Horizons
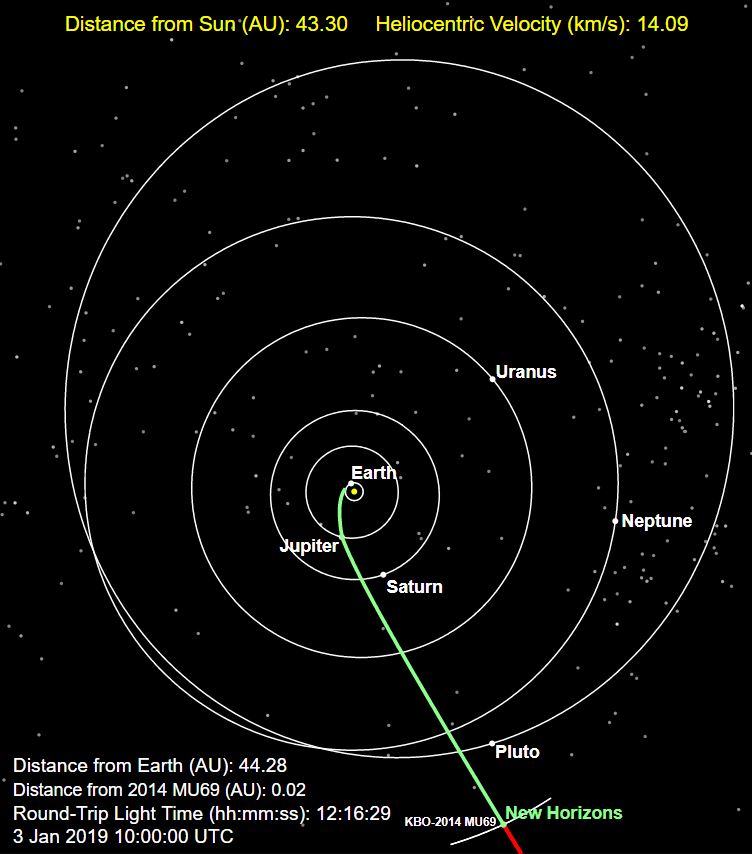
I will start with New Horizons . In Close Encounter with Pluto I described how this spacecraft had a successful flyby with minor planet Pluto on 14 July 2015 and in an update New Horizons that it was on its way to 2014 MU69 , an object in the Kuiper belt.
A few days ago, on 1 January 2019, it had a flyby of Ultima Thule, as 2014 MU69 has been nicknamed. The distance between Earth and Ultima Thule is at the moment 6.6 billion km, never before has there been a close encounter at such a huge distance! (Distances in the picture are expressed in Astronomical Units, 1 AU = 150 million km)
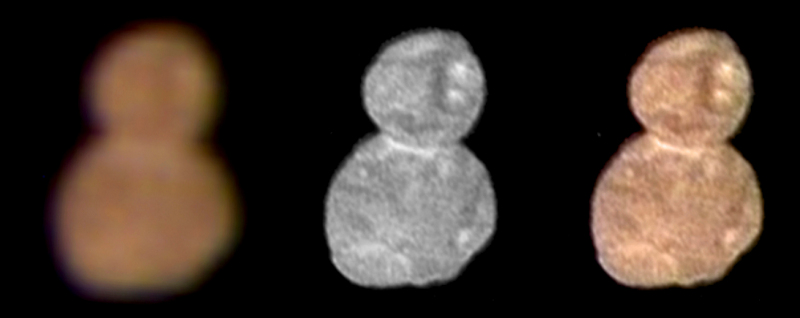
During the brief flyby, New Horizons collected about 7 gigabytes of data, which in the coming months will be sent back to Earth. Radio signals take more than 6 hours to reach Earth, the 15 Watt transmitter can send ~ 500 bits per second, it may take 20 months.
Here are the first images. Left a vague color image, middle a more detailed black and white one, right the merger of the two, a kind of reddish snowman, size about 31 km. As was already expected, Ultima Thule is a so-called contact binary, it consists of two halves, now dubbed Ultima (the larger one) and Thule.
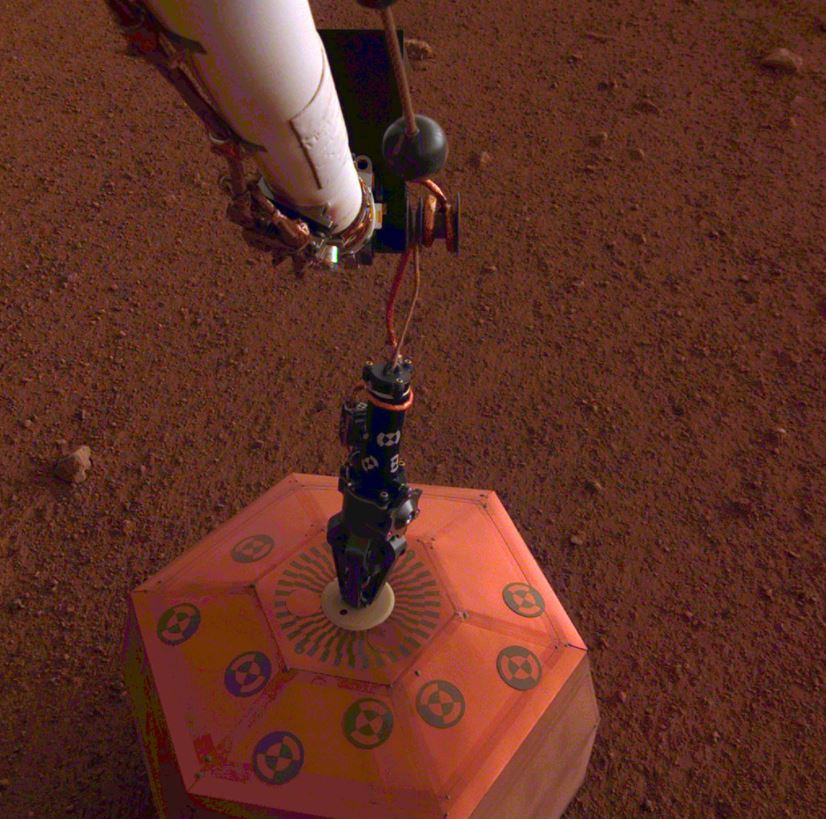
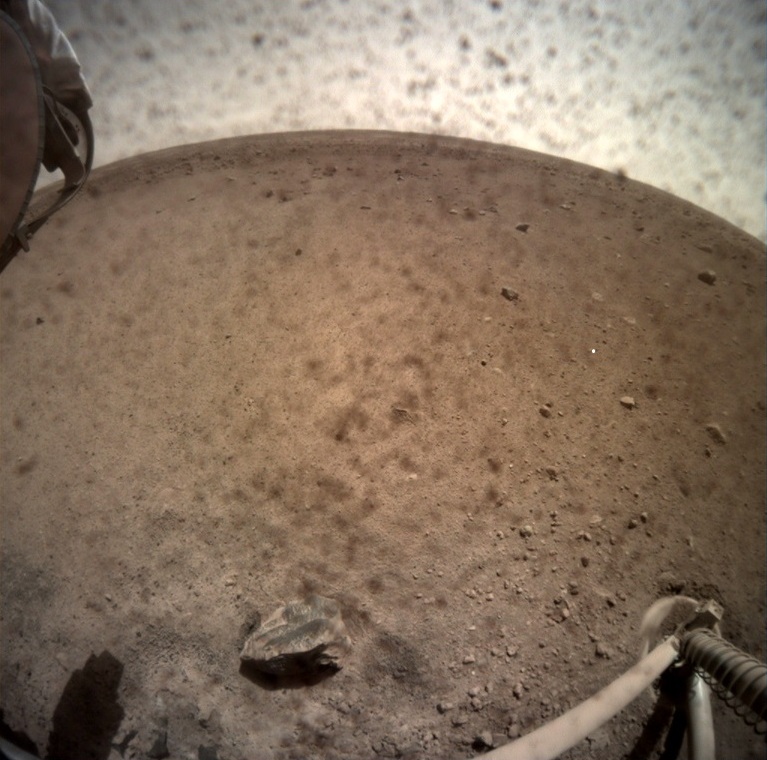
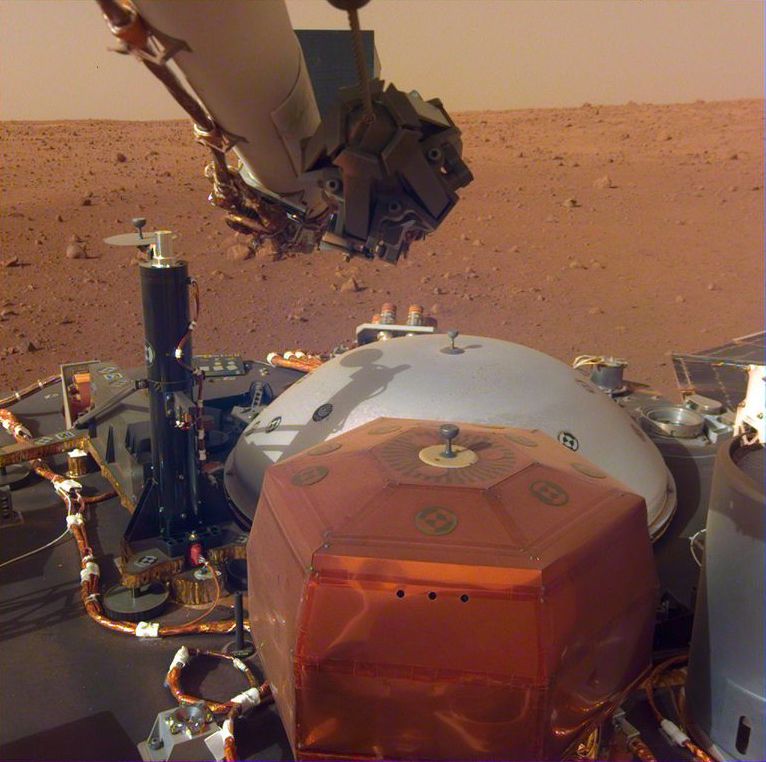
Mars InSight
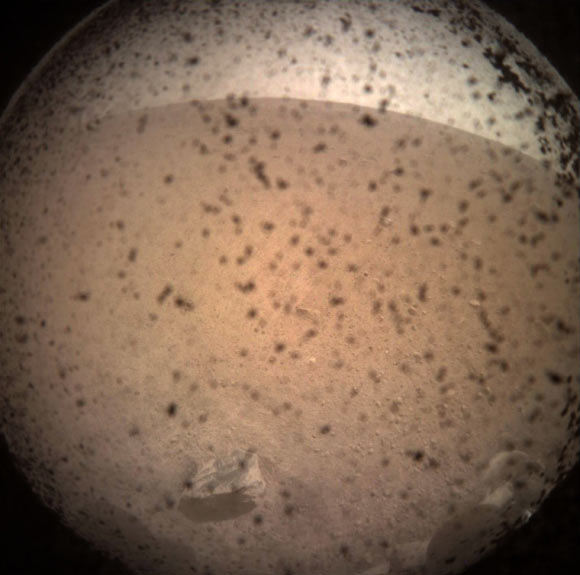
A few months ago I wrote a blog Landing on Mars, about the Mars InSight spacecraft. Mission of this spacecraft is to study the interior structure of Mars. It has now deployed the seismometer, to detect Marsquakes.
Next month InSight will start drilling into the surface of Mars.
Hayabusa2
As I reported in my blog Hayabusa2 , it came as a surprise that the surface of asteroid Ryugu was very rough and rocky. Here is a picture of Ryugu’s surface.
The first sampling touchdown, scheduled for October, was postponed until at least the end of this month. The engineers are still studying how to land the spacecraft safely.
The two tiny hopping Minerva rovers are still working correctly and have been renamed Hibou (French for Owl) and Owl. If you are curious about the reason, read this: Naming our MINERVA-II1 rovers 😉 .. Don’t think that scientists have no sense of humor 😉
Osiris Rex
When I wrote my blog about Hayabusa2, I was unaware of another mission to send a spacecraft to an asteroid, collect some material and bring it back to Earth. It is an American one, the Osiris Rex mission. Here is some information:
Launched 8 September 2016 with as destination the asteroid 101955 Bennu. Bennu is even smaller than Ryugu, about 500 m diameter. In December 2018 Osiris Rex reached Bennu and on 31 December it fired its thrusters to go into orbit. It will remain there for the next two years, studying the asteroid and it will try to acquire at least 60 gram of regolith (the surface material of Bennu) in a procedure very similar to Hayabusa’s.
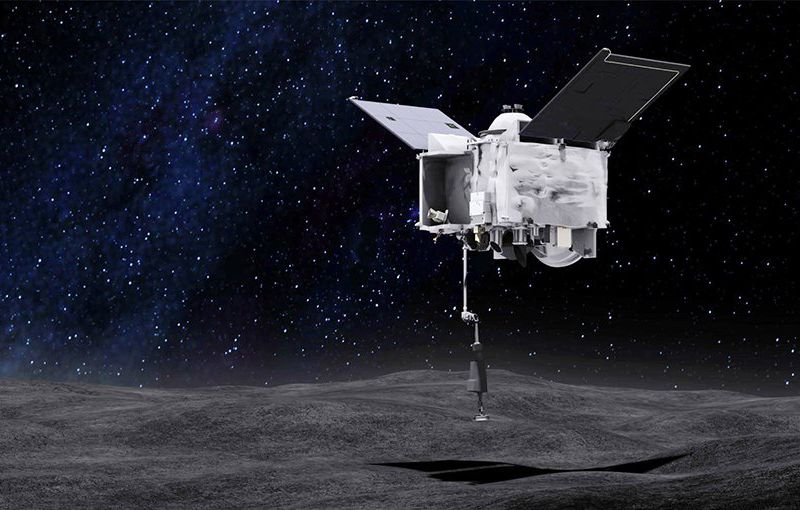
Here is an artist impression of Osiris approaching Bennu, with the sampler horn extended.
And here is an image of Bennu, taken by Osiris.
Planned return date is 24 September 2023.
One aspect of the mission is worth mentioning here. OSIRIS is an acronym for Origins, Spectral Interpretation, Resource Identification, Security. Why security? Because Bennu is a potentially hazardous object, it is possible it might hit Earth in the future. Don’t worry, not in our time, but possibly between 2175 and 2199. The uncertainty is there because the orbits of these “small” asteroids are influenced by many factors, for example the disturbing influence of the other planets. But also the effect of heating and cooling by the sun light, the Yarkovsky effect and it is this effect that Osiris will study. (Forget about this if you find it too complicated… 🙂 )
Chang’e-4
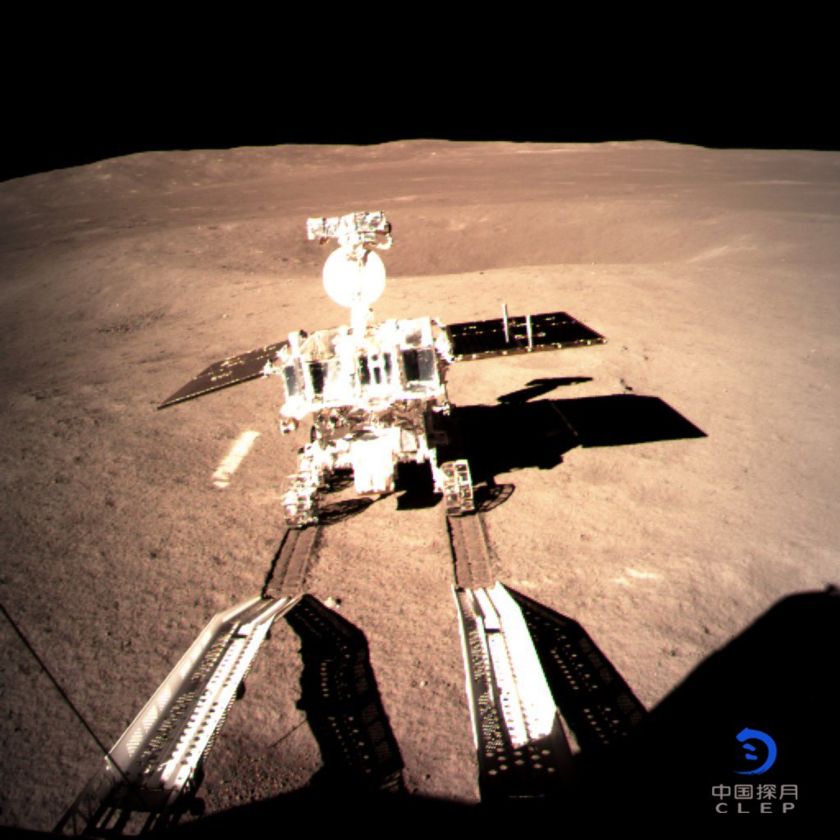
China confirmed its role as global player in space exploration on 3 January 2019, when it landed for the first time in history a spacecraft on the far (“dark”) side of the Moon. The Chang’e 4 was launched on 7 December 2018 and consists of a lander and a rover, the Yutu-2. The set-up and landing procedure were similar to the Mars Pathfinder mission, after a powered descent of the lander to the Moon surface, the rover rolls down a ramp (see my Landing on Mars post).
Here is an image of the Yutu-2, taken by Chang’e 4, just after deployment.
Compared with the missions to Mars and the asteroids, a Moon mission has the advantage that the destination is ~ 384.000 km away from Earth, communication signals take only a bit more than one second. However, for a spacecraft on the far side of the Moon, there is a problem, the Moon itself will block signals to Earth!
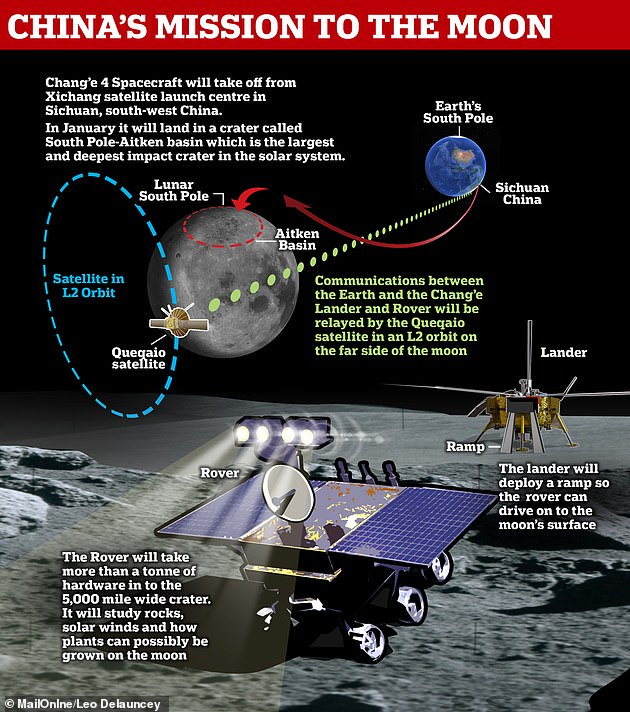
China has found an elegant solution for this problem: a separate satellite has been launched, the Queqiao, a few months before the Chang’e 4 launch. This communication satellite is now in a lunar orbit and will transmit the signals of the spacecraft to Earth and vice versa.
Actually the Queqiao is not orbiting the Moon, but orbiting the L2 Lagrange point, about 60.000 km above the far side of the moon. In my blog Where does the Moon come from, I have discussed a bit the concept of Lagrange points, where the gravitational force of Moon and Earth are in balance. Too complicated to explain the details, check Wikipedia for Halo Orbits.
This infographic illustrates the Chang’e mission. The Chang’e 4 has landed in the Aitken basin, near the Moon’s South Pole. This huge impact crater is 2500 km in diameter and 13 km deep !
There is one amusing detail/mistake in this infographic. It looks like the rover has four headlights! Has the creator of the infographic assumed that you needed lights, because this is the dark side of the moon?
I will update this blog when there are new developments.
Landing a spacecraft on the planet Mars is not a piece of cake!
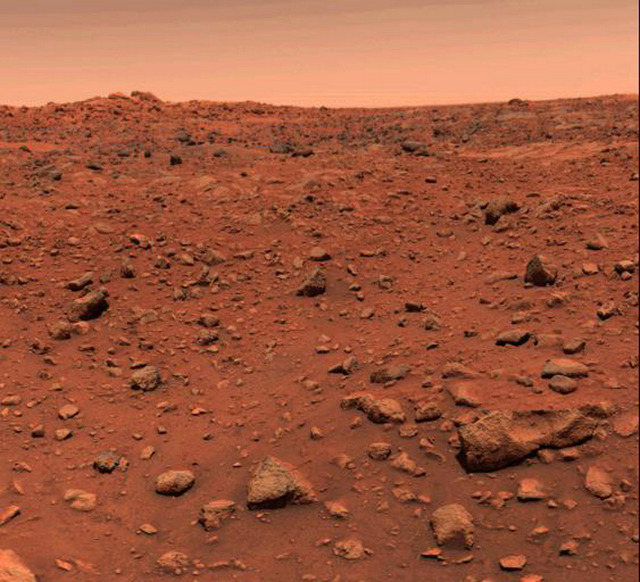
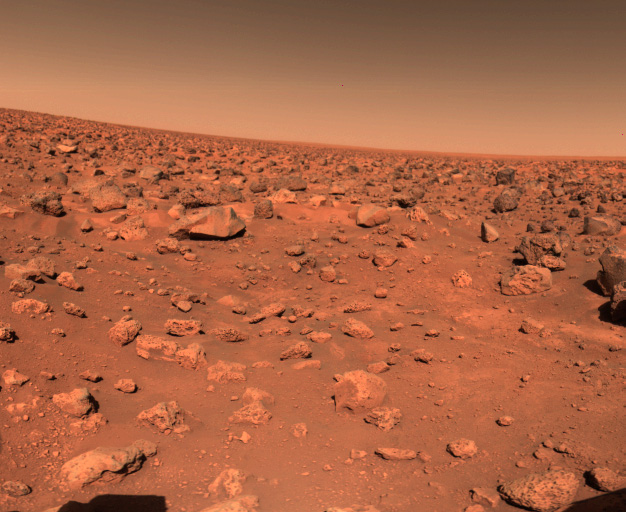
After several failed attempts the first successful landing took place in 1976, when two(!) spacecrafts, the Viking 1 and 2, landed safely on the surface of the Red Planet. And a Red Planet it was. Here are the first (color) pictures taken, left by the Viking 1, right by the Viking 2
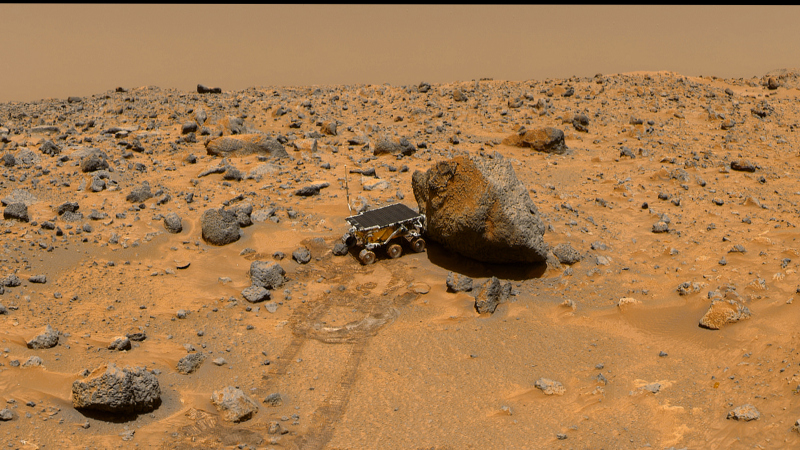
The next successful landing was more than 20 years later, the Mars Pathfinder in 1997. The lander contained a small separate vehicle, a Mars rover, that could independently explore the surface. Here you see the Sojourner, after it had just rolled down from the Pathfinder. It is a tiny vehicle of 63 x 48 x 28 cm and with a mass of about 12 kg.
The next mission was the Mars Exploration Rover in 2004. Two separate missions actually, landing two rovers on Mars, the Spirit and the Opportunity. Both missions were very successful, the two rovers were planned to operate for 90 Sol’s (a Sol is a Martian solar day), but Spirit remained active until 2010 and Opportunity until June this year. Actually they are still trying to contact Opportunity, hoping it survived the huge dust storm that raged on Mars this year. Check this update for the latest info.
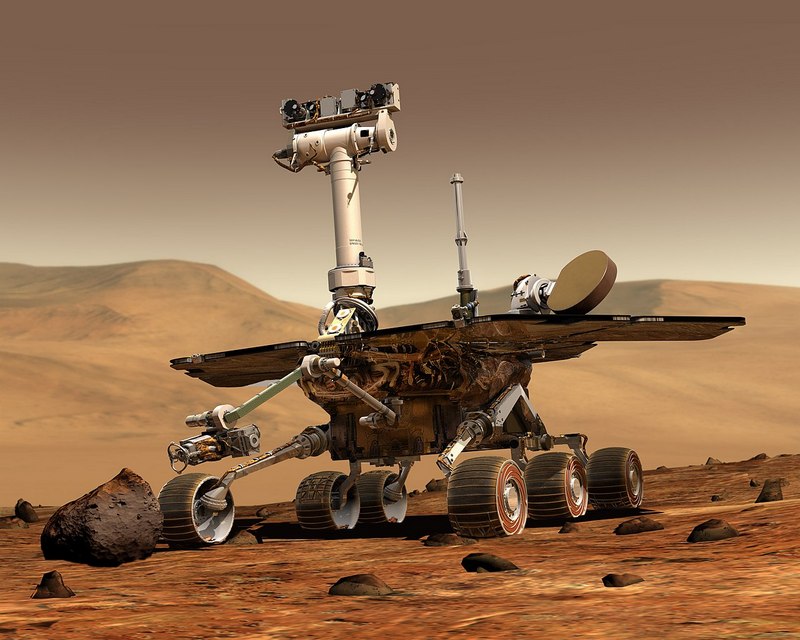
Here is an artist impression of the Opportunity rover. Compared with the Sojourner this is a big boy..:-) , 2.3 x 1.6 x 1.5 m, mass 180 kg. Until the loss of signal on Sol 5111 (June 10, 2018) it had traveled 45.16 km.
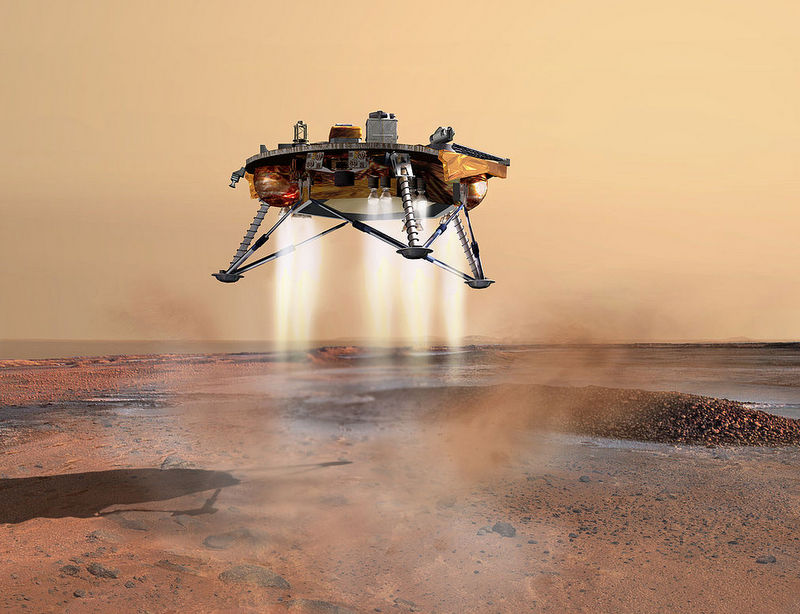
Four years later, in 2008, the Phoenix landed on Mars, for the first time a landing in the polar region. It confirmed the existence of water ice on Mars. Here is an artist impression of the Phoenix landing. Mass about 350 kg
In 2012 the Mars Science Laboratory (MSL) mission landed a rover on Mars, the Curiosity, which is still active at the moment. Dimensions 2.9 x 2.7 x 2.2 m. mass 900 kg.
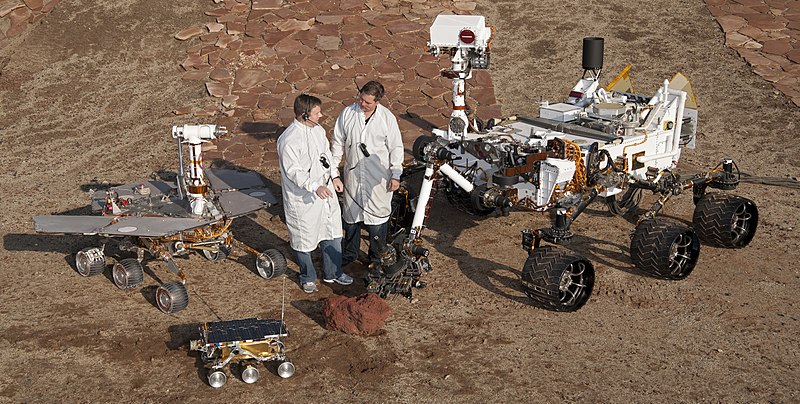
This photo shows the difference in size. In the foreground the Sojourner, left the Opportunity and right the Curiosity.
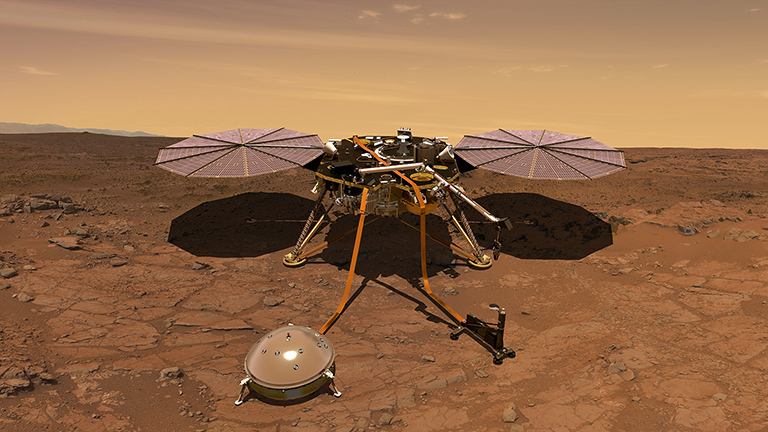
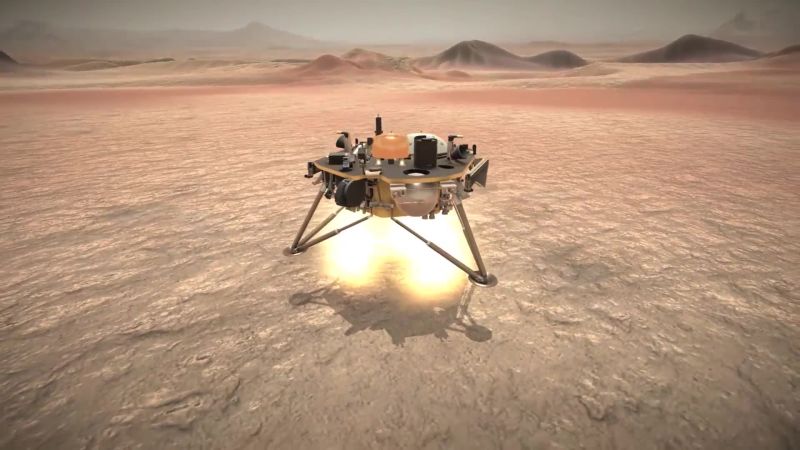
The last successful landing took place two weeks ago, 26 November 2018, when the InSight lander touched the surface of Mars. Diameter of the lander 1.5 m (without its solar panels), mass 360 kg.
Main mission is to get more information about the interior of the planet. A seismometer will record “marsquakes” and a “drill” designed to burrow as deep as 5 m, will measure the heat flow from the interior. Here is an artist impression of the lander with the solar panels deployed. Foreground left the seismometer, right the drill.
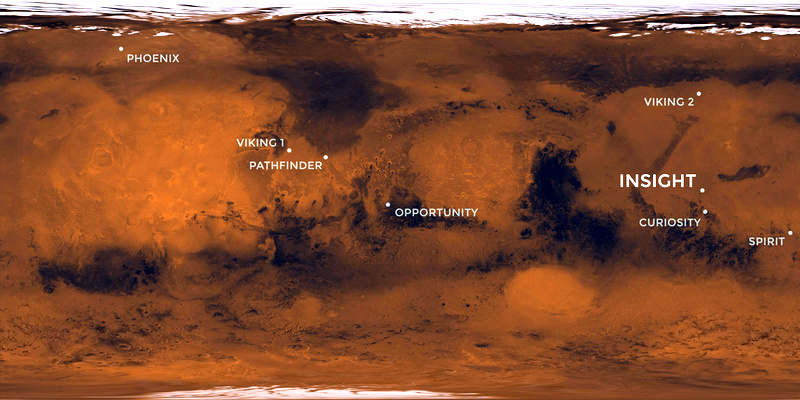
Here is a map of Mars with the location of the eight successful landings.
More than half of all missions failed, for example the Beagle 2 in 2003 and the Schiaparelli in 2016. For a full report , see the Wikipedia article Mars Landing.
Why is landing on Mars so difficult and risky?
Let us look in more detail at what is called the Entry, Descent and Landing (EDL) phase of a Mars mission. This phase starts when the spacecraft enters the atmosphere of Mars and ends about 6-7 minutes later, when it lands on the surface.
For the MSL (Curiosity) mission in 2012, NASA created a fascinating YouTube video: 7 Minutes of Terror, in which scientists and engineers explain how many things can go wrong in this phase, while they can only watch helplessly. Watch the video, it takes only 5 minutes and gives a better explanation than I can provide here…:-)
But let me try. I will concentrate on the Curiosity lander because until now it is by far the most complicated mission of all.
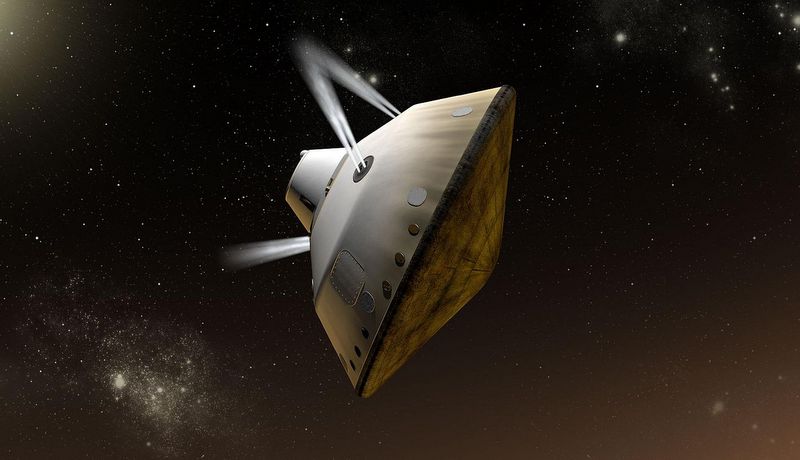
The atmosphere of Mars is very thin, but the spacecraft enters with a high velocity of about 20.000 km/h and would be destroyed if it was not protected by a heat shield. Here is an artist impression of the so-called aeroshell in which the Curiosity (and all other landers) is safely stowed away. It consists of a backshell and a heat shield.
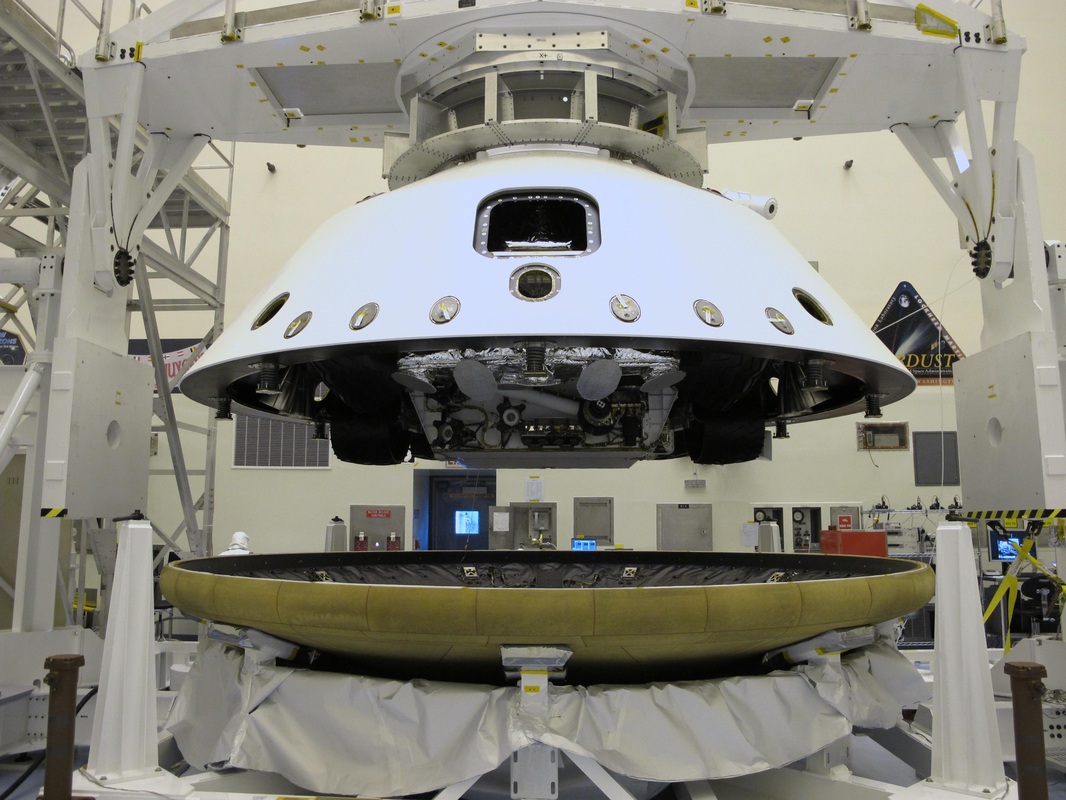
Here is the aeroshell in the assembly hall. The diameter is 4.5 m. You can see the Curiosity inside the backshell. On top of the backshell is the cruise stage which controls the spacecraft during the cruise from Earth to Mars.
An exploded view of the aeroshell. From left to right the cruise stage, the backshell, the descent stage, the Curiosity rover and the heat shield.
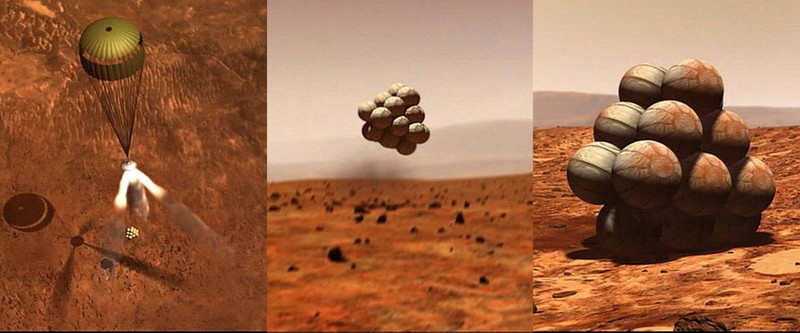
All Mars landing missions have three parts, two of which are basically the same: 1. slowing down by atmospheric friction and 2. further speed reduction by a parachute. You need one more step, because the Martian atmosphere is so thin that a parachute can not reduce the speed to (almost) zero at ground level. One way or another, you need (retro) rocket power for the last part
When the spacecraft is a lander, the “easiest” way is to provide it with retro-rockets. After the lander detaches from the backshell, it will unfold its legs and use its rockets to land. See the picture above of the Phoenix. The InSight used the same solution. Here is a picture of the InSight landing.
Rovers have to move around, so it doesn’t make sense to burden them with the extra weight of these rockets. That’s why for the Pathfinder, Spirit and Opportunity another solution was developed. Put the retro-rockets in the backshell, lower the rover on a tether connected to the backshell, protect it with airbags(!), use the rockets until almost zero speed, then drop the rover. Here is a collage of what it would look like for a Martian observer. Left, the airbags are already inflated, the rover is still hanging under the backshell, which is retro-firing. Middle, the rover has touched the surface but is still bouncing many times, before it comes to rest (right). Then the airbags will deflate and the rover is ready for action. Here is an animation of the landing of the Spirit rover.
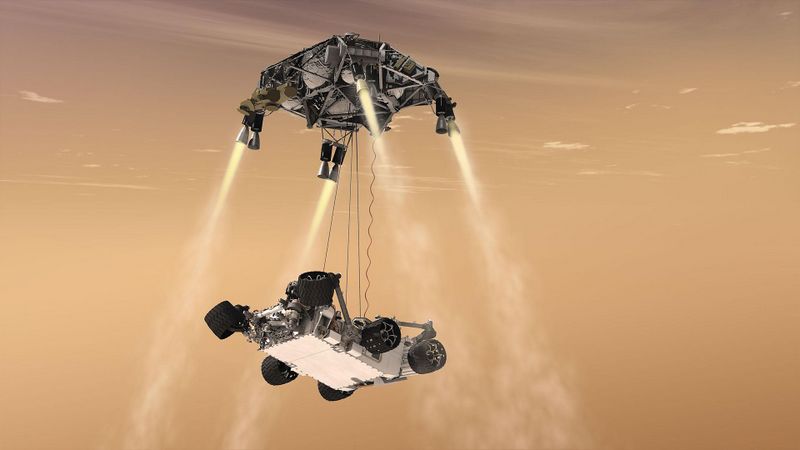
The Curiosity is too heavy and voluminous for this airbag technique, so a spectacular new (and expensive) solution was developed. A sky crane!
Here is a schematic view of the EDL process for the Curiosity. The first phase, atmospheric braking, looks normal, but there is a difference. Before the aeroshell enters the atmosphere at an altitude of 125 km, with a velocity of 20.000 km/h, some mass is ejected one sided (“Cruise Balance Device Separation”). The resulting “unbalance” has as effect that the aeroshell will not move ballistically (like a projectile) but can be “steered” a bit through the atmosphere. The Martian atmosphere has turbulence, storms, pressure differences etc, affecting the trajectory of the aeroshell, resulting in a considerable uncertainty in the final landing location. The “hypersonic aero-maneuvering” reduces this uncertainty, important for Curiosity which had to land close to the rim of the Gale crater.
At an altitude of 10 km from the ground, when the velocity is about 1500 km/h, a huge parachute (diameter 17 m!) is deployed, slowing down the aeroshell further. The heat shield is ejected 20 seconds later. From that moment, using radar, the exact altitude can be measured, and the precise time when the descent stage & rover have to detach from the backshell. The descent stage starts firing the retro-rockets, first to move horizontally away from the backshell and the parachute. Meanwhile the rover is lowered 7.5 m on cables, it deploys its wheels, while still connected through an “umbilical cord with the descent stage. Here is an artist impression.
As soon as the rover touches the ground, the connecting cables are cut and the descent stage will fly up and away, to crash a few hundred meters from the rover
Curiosity has landed! All this (and numerous details I have skipped) must happen in less than 7 minutes. Seven minutes of terror, because everything is automatic. If something goes wrong, nobody can do anything. Besides, the radio signals back to Earth take about 14 minutes, so, when Mission Control gets the message that the spacecraft has entered the atmosphere, it has actually already landed (or crashed….) Here is an animation of the Curiosity landing. Spectacular.
Compared with the Curiosity mission, the landing of InSight was a lot simpler, basically the same as the Phoenix in 2008. The mission of InSight is to study the interior of Mars, the precise landing location is less important, as long as the surface is flat. Therefore no “guided entry” through the atmosphere was needed. The InSight is also much lighter (360 kg) than the Curiosity (900 kg), so it was decided to provide the lander itself with rockets.
Of course it is still a major technological achievement! NASA published a very good explanation of InSight’s EDL phase: InSight landing on Mars .
Here are three pictures taken by the InSight. The lander has two cameras, the Instrument Context Camera is a fisheye camera, mounted underneath the lander deck. In the first picture (left), taken a few minutes after landing, the lens is still protected by a transparent cover, because of the dust whirled up by the rockets. In the right picture the cover has been removed. and as you can see, still a lot of dust has managed to crawl under the cover and stick to the lens. Unfortunate, although the images will still be usable.
The second camera is mounted on a robotic arm, Here is a superb picture taken by this camera. The scientist are very happy with the sandy, rock-free location. The reddish box is the seismometer which later will be deployed after the best location has been determined.
The latest news about the InSight mission can be found here